
3 Types of Forex Market Analysis
By now, you’ve slogged through some forex history, how it works, what affects prices, blah blah blah. . 😴 Yeah, […]
By now, you’ve slogged through some forex history, how it works, what affects prices, blah blah blah. . 😴 Yeah, […]
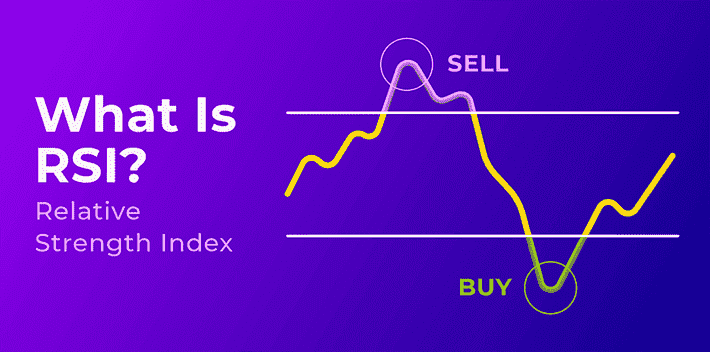
Master forex trading with RSI! Learn how this indicator spots overbought/oversold markets & identifies trends for smarter entry & exit points.

Over 10 years analyzing metals! See a proven analyst’s forecast: silver poised to surge, gold next? Learn more and unlock the potential of the metals market!

Forget the Lambo Dreams: How Tiny Victories Lead to Trading Triumph(Eventually) Let’s face it, folks, the trading world is a

Every investor faces a crucial question: how to structure their portfolio? It’s a balancing act, like juggling eggs (hopefully, your