Recession Hits Global Economy: Trump’s Tariffs Add to the Chaos
The global economy tumbles into recession in April 2025, with markets crashing and Trump’s tariffs worsening the crisis.
The global economy tumbles into recession in April 2025, with markets crashing and Trump’s tariffs worsening the crisis.

Gold is on fire in April 2025, hitting $3,125 per ounce! Investors are flocking to this safe-haven asset as inflation and market chaos fuel its rally.
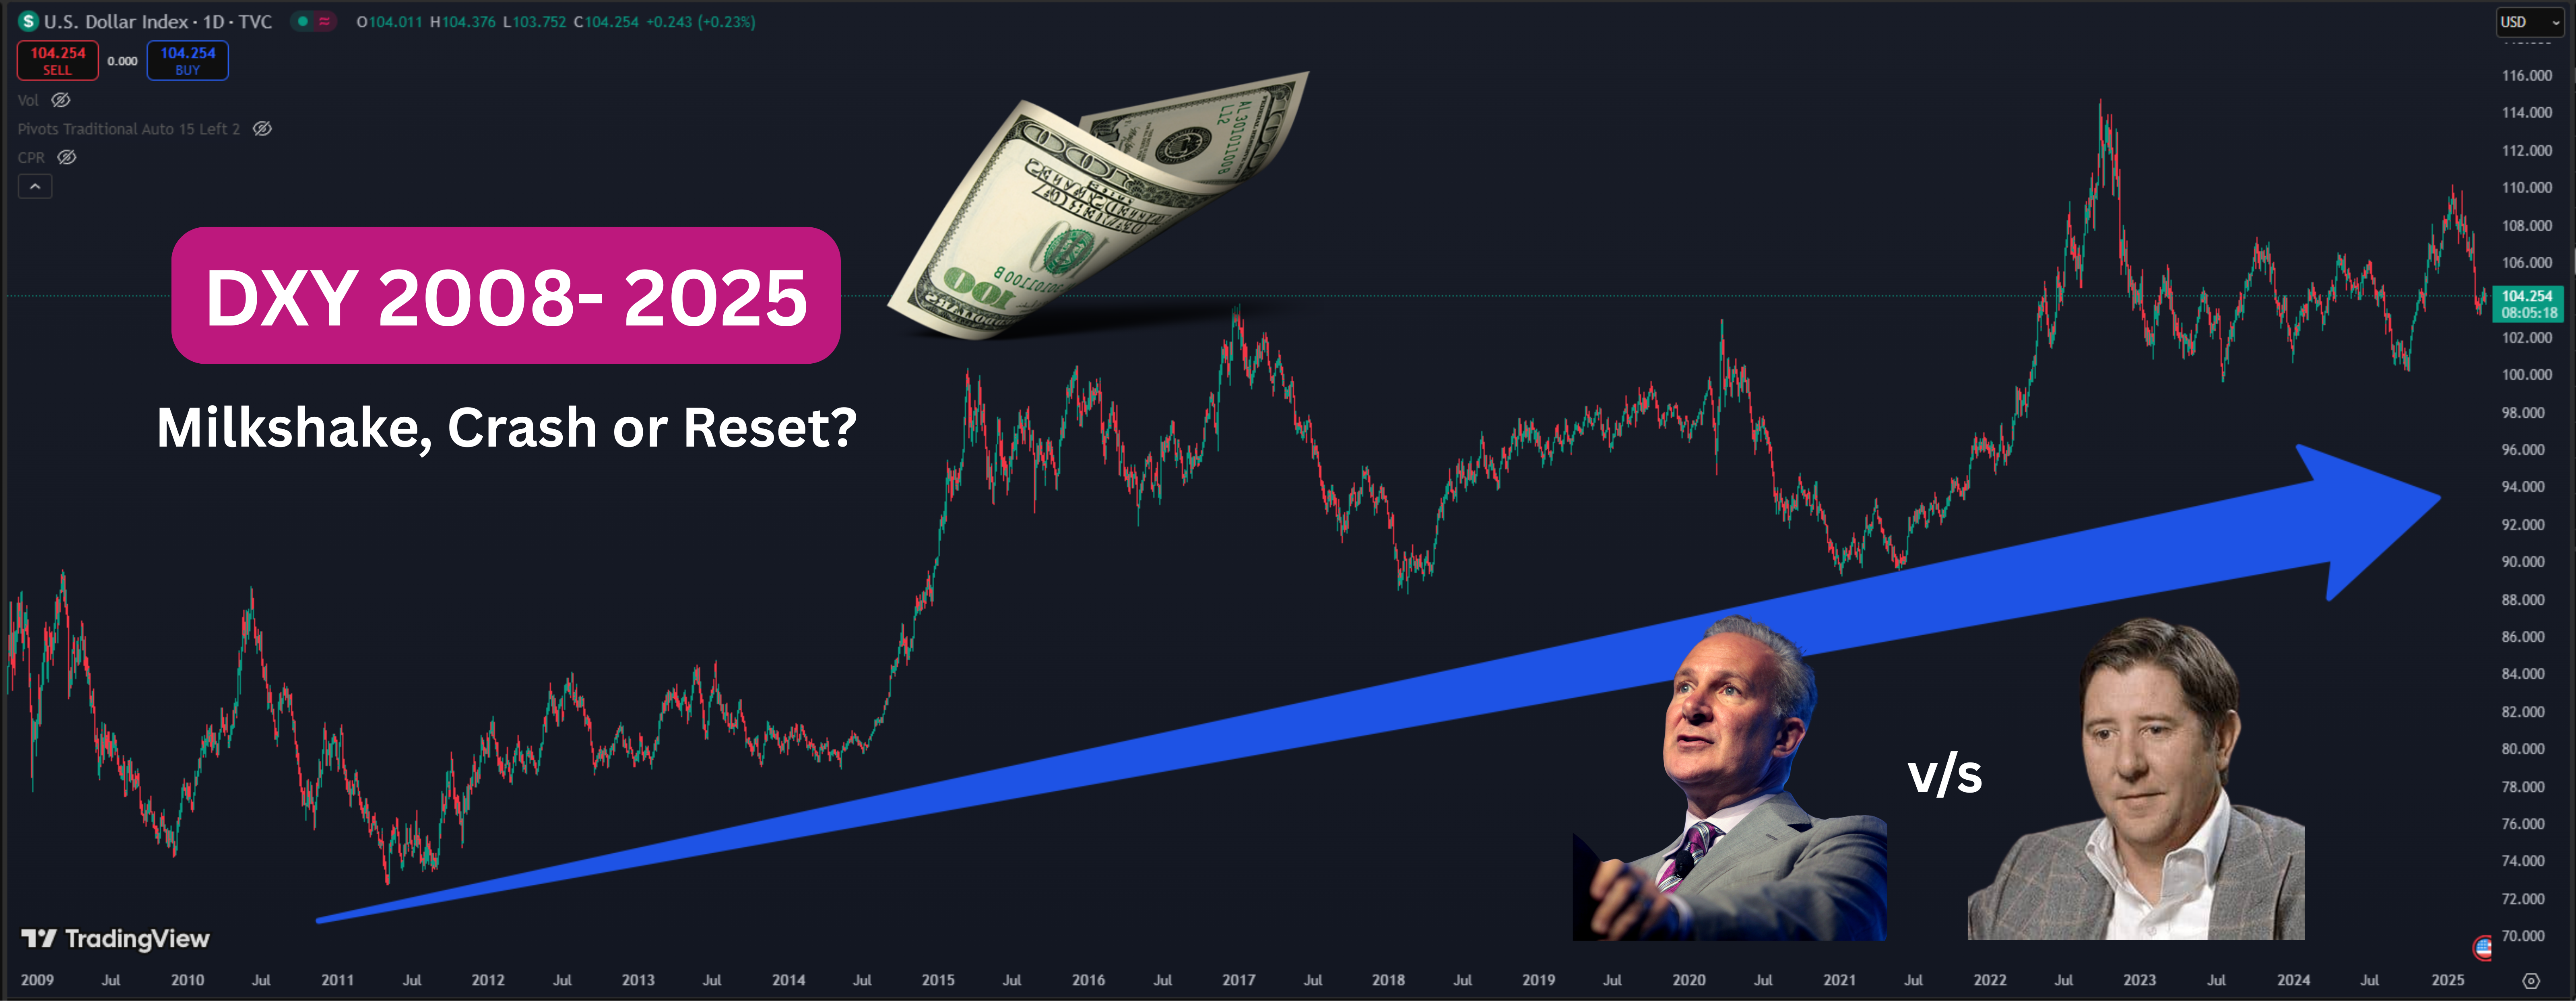
Inflation, debt, and interest rates—how will they shape the Dollar in 2025 and beyond? This deep dive breaks down expert insights and projections.

SPY Crash bearish flag breakdown in March 2025 signals a major market shift. Don’t miss these key trade insights!

The Setup Sniper method proves patience pays—trade less, profit more with precision.

Debt, Bitcoin, and high stakes—Michael Saylor navigates a risky financial game.

The FX market was packed with action last week, from the Fed’s cautious stance to the euro’s struggles. Here’s what’s next for March!

Risk management guide saves portfolios- Learn to use the essential tools to trade smarter.
In the ever-evolving Forex market, March 2025 sees the Dollar Milkshake Theory and Triffin’s Dilemma battle over the dollar’s future dominance.

Forex markets are wilder than ever—AI rules, politics shift trends, and traders must adapt fast. Ready?