Category: Learn

  • Elevate Your Forex Trading with the Mighty Ichimoku Cloud Indicator: A Guide to Success

    Elevate Your Forex Trading with the Mighty Ichimoku Cloud Indicator: A Guide to Success

    If you’re stepping into the world of forex trading, the Ichimoku Cloud Indicator is your formidable ally, capable of guiding you through the intricate realm of the foreign exchange market. Whether you’re a seasoned trader or just beginning your forex journey, mastering this powerful indicator can revolutionize your approach and elevate your trading success.

    In this comprehensive guide, we will unravel the mystique surrounding the Ichimoku Cloud Indicator. We’ll embark on a journey to dissect its intricate components, demystify its inner workings, and equip you with a diverse array of strategies that hold the promise of catapulting your forex trading endeavors to new heights.

    The foreign exchange market can often appear as an enigmatic sea of currencies in constant flux, and navigating it demands more than just a rudimentary understanding of charts and numbers. It necessitates a profound insight, an analytical edge, and an ally that can offer clarity amidst the chaos. The Ichimoku Cloud Indicator is precisely that ally, poised to illuminate your trading path, irrespective of whether you’re a novice or a seasoned trader.

    As we embark on this comprehensive journey, envision the Ichimoku Cloud Indicator as your guiding star through the turbulent waters of forex trading. It’s a tool that can help you decipher market trends, identify critical entry and exit points, and ultimately, steer your trading vessel toward the shores of success. So, fasten your seatbelts, for this guide is your passport to unlocking the full potential of the Ichimoku Cloud Indicator in the world of forex trading.

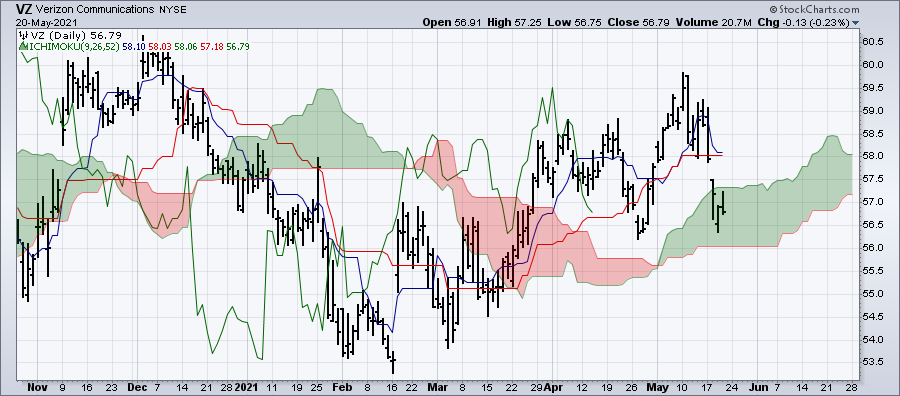
    The Ichimoku Cloud Indicator, also known as Ichimoku Kinko Hyo, is a comprehensive technical analysis tool renowned for providing a holistic view of the forex market. Its multifaceted nature enables traders to gain profound insights into price movements, offering a distinct advantage in the world of forex trading. To unlock the full potential of the Ichimoku Cloud, it’s essential to delve into its key components, each contributing to a comprehensive analysis:

    Ichimoku Cloud Indicator

    The Tenkan Sen, often referred to as the Conversion Line, plays a pivotal role in the Ichimoku Cloud’s analytical framework. It is a short-term moving average calculated by averaging the highest high and the lowest low over a specific period, typically nine periods. The Tenkan Sen serves as a valuable tool for understanding short-term price momentum.

    How to Use Tenkan Sen:

    1. Crossovers for Trend Reversals: One of its primary functions is to identify potential trend reversals. When the Tenkan Sen crosses above the Kijun Sen, it signals a potential bullish reversal. Conversely, when it crosses below the Kijun Sen, it indicates a potential bearish reversal.
    2. Assessing Trend Strength: The angle and steepness of the Tenkan Sen offer insights into the strength of the current trend. A steep upward slope suggests a strong bullish trend, while a steep downward slope indicates a robust bearish trend.

    Understanding the Tenkan Sen is crucial as it helps traders make informed decisions about market entry and exit points, contributing to a well-rounded trading strategy. However, the Tenkan Sen is just one piece of the Ichimoku puzzle, and a comprehensive analysis requires considering the other components as well.

    Now, let’s explore the Kijun Sen, another essential component of the Ichimoku Cloud, which complements the Tenkan Sen in providing a more comprehensive view of market trends and movements.

    The Kijun Sen, often referred to as the Base Line, serves as another indispensable component within the Ichimoku Cloud Indicator. Unlike the Tenkan Sen, which provides a short-term perspective, the Kijun Sen offers a longer-term view of price movements. Calculated over a period of 26 periods, it plays a vital role in deciphering market dynamics and serves as both a support and resistance level.

    How to Use Kijun Sen:

    1. Crossovers for Support and Resistance: One of the key applications of the Kijun Sen is in identifying potential areas of support and resistance. When the price interacts with the Kijun Sen, it can signify significant levels where price trends may reverse or encounter obstacles.
      • A price crossing above the Kijun Sen suggests a potential upward move, indicating a support level.
      • Conversely, a price crossing below the Kijun Sen implies a possible downward move, representing a resistance level.
    2. Analyzing Market Volatility: The distance between the Tenkan Sen and the Kijun Sen can provide valuable insights into market volatility. A wider gap between these lines suggests higher volatility, signifying substantial price swings. In contrast, a narrower gap indicates relatively lower volatility and more stable price movements.

    Understanding the Kijun Sen’s role in the Ichimoku Cloud Indicator is essential for traders aiming to navigate the forex market successfully. It complements the insights gained from the Tenkan Sen, offering a broader perspective on price movements and helping traders identify critical support and resistance levels. As with any technical analysis tool, the Kijun Sen becomes even more powerful when used in conjunction with the other components of the Ichimoku Cloud.

    Now, let’s explore the Chikou Span, another integral element of this comprehensive indicator, and understand how it contributes to a well-rounded analysis of forex market trends.

    In the intricate world of the Ichimoku Cloud Indicator, the Senkou Span holds a special place as it forms the foundation of the Kumo, the cloud-like area on an Ichimoku chart. The Kumo is a dynamic zone that plays a pivotal role in identifying potential areas of support and resistance. To comprehend the Senkou Span’s significance, it’s essential to delve into its components, Senkou Span A and Senkou Span B.

    Senkou Span A: This component represents the average of the Tenkan Sen and Kijun Sen, and it’s projected 26 periods ahead on the chart. It offers insights into the mid-term equilibrium of price movements.

    Senkou Span B: On the other hand, Senkou Span B is calculated by averaging the highest high and lowest low over the last 52 periods. Similar to Senkou Span A, it’s projected 26 periods ahead. Senkou Span B provides a longer-term perspective on market trends.

    How to Use Senkou Span:

    1. Dynamic Support and Resistance: One of the primary applications of the Senkou Span is in defining dynamic support and resistance levels. These levels are represented by the upper and lower boundaries of the Kumo, formed by Senkou Span A and Senkou Span B, respectively. Traders often observe price interactions with the Kumo to identify potential areas where price trends may stall, reverse, or accelerate.
      • When the price is above the Kumo (cloud), the Kumo serves as a potential support zone.
      • Conversely, when the price is below the Kumo, it functions as a potential resistance zone.
    2. Future Cloud Projections: Traders closely monitor the future projections of the Kumo, formed by Senkou Span A and Senkou Span B. These projections can provide valuable insights into potential trend directions.
      • If Senkou Span A is projected above Senkou Span B, it indicates a bullish (upward) trend projection.
      • Conversely, if Senkou Span B is projected above Senkou Span A, it suggests a bearish (downward) trend projection.

    Understanding the Senkou Span’s role in the Ichimoku Cloud Indicator equips traders with a dynamic tool to assess potential price levels, support and resistance zones, and future trend directions. It adds depth and context to the analysis, making it an essential component of the comprehensive Ichimoku system.

    Now, let’s explore the final piece of the puzzle, the Ichimoku Cloud Components, to grasp how they all come together to elevate your forex trading success.

    In the realm of the Ichimoku Cloud Indicator, the Chikou Span, often referred to as the Lagging Span, plays a unique role by offering a retrospective view of price action. It is essentially the closing price of the current candlestick, but it’s plotted 26 periods back on the chart. This seemingly backward-looking component is a valuable tool for traders seeking to uncover historical insights and validate trading signals.

    How to Use Chikou Span:

    1. Trend Reversal Identification: One of the primary utilities of the Chikou Span is its ability to help identify potential trend reversals. By comparing the Chikou Span’s position relative to past price action, traders can gain critical insights into the market’s sentiment.
      • When the Chikou Span crosses above past price action, it may indicate a potential bullish reversal.
      • Conversely, when the Chikou Span crosses below past price action, it might signify a potential bearish reversal.
      • The Chikou Span essentially serves as a “confirmation” tool that aligns with the Ichimoku system’s holistic approach to trading.
    2. Confirmation of Signals: The Chikou Span is often used in conjunction with other Ichimoku components to confirm trading signals. For instance, if the Tenkan Sen and Kijun Sen generate a crossover signal, traders may look to the Chikou Span to validate the signal by ensuring that it aligns with historical price action.
      • If the Chikou Span supports the crossover signal by showing that it is in harmony with past price movements, it can boost the trader’s confidence in the validity of the signal.
      • This confirmation aspect of the Chikou Span enhances the reliability of trading decisions.

    In essence, the Chikou Span acts as a historical reference point, allowing traders to gauge the effectiveness of trading signals and identify potential trend reversals. Its unique role in the Ichimoku Cloud Indicator adds an extra layer of insight to the analysis, making it a valuable component for traders seeking to elevate their forex trading success.

    Now that we’ve explored each of the key components of the Ichimoku Cloud Indicator in detail, it’s time to bring it all together and understand how these components interact to guide your trading decisions.

    With a solid grasp of the Ichimoku Cloud components, it’s time to embark on a journey of practical application. Let’s explore how to harness the power of this formidable indicator to enhance your forex trading strategies and elevate your chances of success in the dynamic world of currency trading.

    One of the primary objectives of the Ichimoku Cloud is to provide traders with a precise means of identifying trends in the market. It’s the first step toward making informed trading decisions. Here’s how you can leverage the Ichimoku Cloud for trend identification:

    1. Bullish Trends: When the market is in a bullish trend, you’ll notice that the price is positioned above the Kumo, the cloud-like area on the Ichimoku chart. In addition to this, both Senkou Span A and Senkou Span B should be pointing upwards. This combination of factors signals a robust bullish sentiment, indicating potential opportunities for long positions.
    2. Bearish Trends: Conversely, when the market is in a bearish trend, the price tends to reside below the Kumo. Moreover, both Senkou Span A and Senkou Span B slope downwards. This alignment suggests a strong bearish sentiment, highlighting the possibility of profitable short positions.
    3. Sideways Markets: In scenarios where the market is moving sideways, the price tends to oscillate within the Kumo, and both Senkou Span A and Senkou Span B remain relatively flat. This indicates a lack of a clear trend, signaling the need for caution and a focus on alternative trading strategies such as range trading.
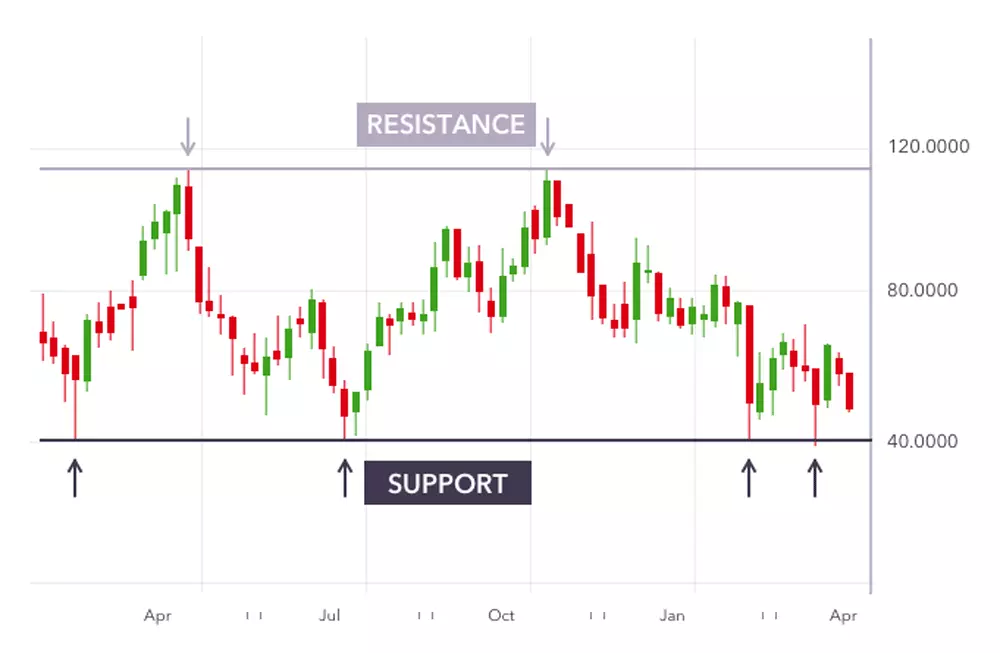
    The Kumo, which forms the heart of the Ichimoku Cloud, serves as a dynamic support and resistance zone. It’s a critical aspect of the Ichimoku system that can significantly influence your trading decisions:

    1. Support in Bullish Trends: When the price resides above the Kumo, the cloud acts as a support level. This means that during bullish trends, if the price experiences a temporary pullback and approaches the Kumo, it’s likely to find support in this zone, potentially presenting an attractive entry point for long positions.
    2. Resistance in Bearish Trends: Conversely, in bearish trends where the price is below the Kumo, the cloud transforms into a resistance level. Should the price attempt to rally and approach the Kumo, it’s expected to encounter resistance. This resistance zone can be a compelling area for considering short positions.

    The Ichimoku Cloud’s components generate a variety of signals that serve as valuable guides for making entry and exit decisions:

    1. Tenkan Sen and Kijun Sen Crossovers: Pay close attention to the interaction between the Tenkan Sen and Kijun Sen lines. A bullish signal occurs when the Tenkan Sen crosses above the Kijun Sen, suggesting a potential upward movement in prices. Conversely, a bearish signal emerges when the Tenkan Sen crosses below the Kijun Sen, indicating a possible downtrend. These crossovers can guide your entry and exit points with precision.
    2. Kumo Breakout: Keep an eye on price movements concerning the Kumo. A breakout from the Kumo can signify a substantial shift in market sentiment and a potential trend reversal. If the price breaks out of the Kumo, consider it as a compelling entry signal.
    3. Chikou Span Confirmation: The Chikou Span, often referred to as the Lagging Span, plays a vital role in confirming signals generated by other Ichimoku components. When the Chikou Span aligns with a bullish or bearish trend, it strengthens the signal’s credibility. This confirmation aspect enhances your confidence in the validity of trading decisions.

    In essence, the Ichimoku Cloud is not just a technical indicator; it’s your roadmap to navigating the complexities of the forex market. By effectively utilizing its components to identify trends, gauge support and resistance levels, and seize entry and exit opportunities, you can elevate your forex trading success to new heights. The Ichimoku Cloud becomes your guiding light through the ever-shifting terrain of currency trading, helping you make well-informed decisions and capture profitable trading opportunities.

    Now that you’ve mastered the essentials of trading with the Ichimoku Cloud, let’s delve deeper into specific strategies and practical tips for incorporating this powerful indicator into your forex trading arsenal.

    With a firm grasp of the Ichimoku Cloud’s components and their role in forex analysis, it’s time to delve into specific trading strategies that can help you harness the full potential of this indicator. Whether you’re a novice trader seeking guidance or an experienced trader looking to refine your approach, these Ichimoku Cloud strategies can elevate your forex trading success.

    Trend following is a widely adopted strategy among Ichimoku Cloud enthusiasts. It enables traders to capitalize on sustained market trends with precision. Here’s how to implement this strategy:

    • Identify the Trend: Begin by observing the Ichimoku Cloud and its components. Look for a clear bullish or bearish trend as indicated by the cloud and its various elements.
    • Execute Entry: To enter a trade in the direction of the trend, wait for the Tenkan Sen to cross either above (for a bullish trend) or below (for a bearish trend) the Kijun Sen. This crossover serves as a strong initial signal.
    • Trail the Trade: Once you’re in the trade, use the cloud itself as a trailing stop. Stay in the trade as long as the cloud remains aligned with the prevailing trend. This trailing stop strategy allows you to maximize gains as the trend continues.

    The Kumo breakout strategy is designed to capture significant price movements as they emerge from the cloud. It’s a powerful technique for identifying potential trend reversals or accelerations. Here’s how it works:

    • Wait for the Breakout: Exercise patience as you observe the price’s interaction with the Kumo (cloud). Your objective is to wait for a convincing breakout from the cloud in the direction of the prevailing trend.
    • Execute the Trade: Once the price successfully breaks out of the cloud, consider it a compelling entry signal. Enter a trade in alignment with the breakout direction, whether it’s bullish or bearish.
    • Utilize Ichimoku Elements: As the trade progresses, leverage other Ichimoku components such as the cloud itself or the Chikou Span. These elements can serve as potential support or resistance levels, aiding in trade management.

    The Senkou Span cross strategy leverages the interaction between Senkou Span A and Senkou Span B to generate valuable trading signals. It enhances the clarity of trends and potential reversals. Here’s how to apply this strategy:

    • Bullish and Bearish Signals: Keep a keen eye on the crossover of Senkou Span A and Senkou Span B. When Senkou Span A crosses above Senkou Span B, it generates a bullish signal, indicating potential upward momentum. Conversely, when Senkou Span A crosses below Senkou Span B, it generates a bearish signal, signaling potential downward pressure.
    • Confirmation through Integration: While the Senkou Span cross is a robust signal on its own, consider integrating it with other Ichimoku signals for added confirmation. This approach enhances the reliability of your trading decisions.

    Incorporating these Ichimoku Cloud strategies into your forex trading toolkit can provide you with a significant edge in the market. Whether you prefer trend following, breakout strategies, or crossovers, the Ichimoku Cloud offers a versatile set of tools to enhance your trading success. As you gain experience, remember that practice and continuous learning are key to mastering these strategies and adapting them to various market conditions.

    In the world of forex trading, knowledge, and strategy are your allies. With the Ichimoku Cloud as your guide, you’re equipped to navigate the complex and dynamic landscape of currency trading with confidence and precision.

    As you embark on your journey to master the Ichimoku Cloud Indicator and elevate your forex trading, it’s crucial to be aware of common missteps that traders often encounter. Avoiding these pitfalls can help you harness the full potential of this powerful tool and enhance your trading success.

    One of the prevalent mistakes traders make when incorporating the Ichimoku Cloud is overcomplicating their trading strategies. While it’s tempting to use numerous indicators or intricate approaches in conjunction with the Ichimoku Cloud, simplicity often proves to be more effective. Overloading your strategy with too many elements can lead to confusion and clouded judgment.

    Tip: Stick to the fundamental principles of Ichimoku analysis. Focus on mastering the core components of the indicator and understanding their interactions. A clear and straightforward approach can yield more consistent results.

    In the pursuit of profits, traders sometimes neglect proper risk management, which is a critical aspect of successful trading. Ignoring risk management can expose your trading capital to unnecessary hazards. To mitigate this, always implement sound risk management techniques:

    • Set Stop-Loss Orders: Determine stop-loss levels for each trade to limit potential losses. These orders act as a safety net, ensuring that you exit a trade if it moves against you beyond a predefined point.
    • Manage Position Sizes: Avoid overcommitting your capital to a single trade. Define the appropriate position size based on your risk tolerance and the size of your trading account. Diversify your trades to spread risk.

    Tip: Prioritize capital preservation alongside profit generation. A disciplined approach to risk management is essential for long-term success in forex trading.

    While the Ichimoku Cloud provides valuable insights into price trends and potential reversals, it’s essential to consider the broader market context. Neglecting economic events, geopolitical factors, and overall market sentiment can hinder your trading analysis.

    Tip: Integrate Ichimoku signals with a comprehensive understanding of the market environment. Stay informed about global economic trends and significant news events that could impact your trades. A well-rounded analysis considers both Ichimoku signals and the broader context.

    By steering clear of these common mistakes and adhering to best practices, you can optimize your use of the Ichimoku Cloud Indicator. Keep your trading strategy straightforward, prioritize risk management, and maintain awareness of the broader market landscape. With these principles in mind, you’re better equipped to navigate the forex market successfully and elevate your trading endeavors to new heights.

    As you become more proficient in your forex trading journey, it’s essential to explore advanced Ichimoku techniques that can take your trading prowess to the next level. These strategies are designed for experienced traders who are well-acquainted with the basics of the Ichimoku Cloud Indicator. Let’s delve into these advanced techniques and how they can enhance your trading strategies:

    Advanced traders often employ multiple timeframe analysis when using the Ichimoku Cloud. This approach involves applying Ichimoku on various timeframes simultaneously. By doing so, you can confirm signals and gain a more comprehensive perspective on the market’s direction.

    For instance, if you identify a bullish signal on the daily chart, you can cross-verify it with the Ichimoku analysis on shorter timeframes, such as the 4-hour or 1-hour charts. If these lower timeframes also exhibit bullish signals, it adds more weight to your trading decision.

    Experienced traders understand that not all currency pairs or timeframes behave the same way. To adapt to varying market conditions, you can experiment with customized settings for the Ichimoku components.

    For example, you can adjust the parameters for the Tenkan Sen, Kijun Sen, or Senkou Span to better suit specific currency pairs or timeframes. Customization allows you to fine-tune the indicator’s sensitivity, making it more responsive to the nuances of different markets.

    To create more robust trading strategies, advanced traders often combine the Ichimoku Cloud with other technical indicators. This synergy provides a comprehensive view of the market and enhances the accuracy of trading signals.

    You can pair the Ichimoku Cloud with indicators like the Relative Strength Index (RSI), Moving Average Convergence Divergence (MACD), or the Fibonacci retracement levels. These combinations allow you to corroborate Ichimoku signals with additional confirmation from other indicators.

    Tip: While combining indicators can strengthen your strategy, be cautious not to overcrowd your charts with too many elements. Maintain a balance between simplicity and effectiveness.

    In conclusion, advanced Ichimoku techniques offer experienced traders valuable tools to elevate their forex trading endeavors. Multiple timeframe analysis provides a broader perspective, customized settings adapt to specific market conditions, and combining with other indicators strengthens your overall strategy. As you delve into these advanced strategies, remember that continuous learning and practice are key to mastering the art of Ichimoku Cloud trading.

    The Ichimoku Cloud Indicator, with its multifaceted components and unique approach to technical analysis, offers traders a wide range of benefits. However, like any tool, it also has its limitations. To make the most of this powerful indicator, it’s crucial to understand both its advantages and shortcomings. Let’s explore the benefits and limitations of the Ichimoku Cloud:

    1. Holistic View of Market Trends: One of the standout advantages of the Ichimoku Cloud is its ability to provide traders with a holistic view of market trends. It accomplishes this by considering various aspects of price action, such as support, resistance, and momentum. This comprehensive perspective helps traders make more informed decisions.
    2. Clear Entry and Exit Signals: The Ichimoku Cloud excels in generating clear entry and exit signals. Whether you’re a novice or experienced trader, the indicator’s components offer distinct cues on when to enter a trade, where to set stop-loss orders, and when to take profits. This clarity enhances the precision of your trading strategies.
    3. Dynamic Support and Resistance Levels: The Kumo, or cloud, formed by the Ichimoku Cloud’s Senkou Span A and Senkou Span B, acts as dynamic support and resistance levels. These levels adapt to changing market conditions, providing valuable insights into potential price reversals. Traders can use the cloud to identify key areas of interest.
    4. Suitable for Various Timeframes and Currency Pairs: Versatility is another hallmark of the Ichimoku Cloud. It’s applicable to a wide range of timeframes, from intraday trading to long-term investing. Additionally, this indicator is not limited to specific currency pairs, making it accessible to traders in different markets.
    1. Learning Curve: The Ichimoku Cloud Indicator has a relatively steep learning curve. Due to its multifaceted components and unique terminology, beginners may find it challenging to grasp initially. However, with dedication and practice, traders can overcome this hurdle.
    2. Conflicting Signals in Ranging Markets: While the Ichimoku Cloud excels in trending markets, it can generate conflicting signals in ranging or sideways markets. Traders may receive mixed cues that make it harder to determine market direction during such conditions. In these scenarios, additional analysis techniques may be needed for confirmation.
    3. Not a Standalone Solution: The Ichimoku Cloud should not be used as a standalone solution for trading decisions. While it offers a holistic view of the market, it’s essential to complement it with other analysis techniques, such as fundamental analysis, market sentiment, or other technical indicators. Relying solely on the Ichimoku Cloud may lead to missed opportunities or erroneous decisions.

    In conclusion, the Ichimoku Cloud Indicator is a robust tool that can significantly enhance your forex trading strategies. Its benefits include providing a comprehensive market view, offering clear signals, and adaptability to various timeframes and currency pairs. However, traders should be aware of its learning curve, potential challenges in ranging markets, and the importance of using it alongside other analysis techniques. With proper understanding and practice, the Ichimoku Cloud can be a valuable ally in your trading journey.

    In conclusion, the Ichimoku Cloud Indicator is a potent ally for forex traders seeking to elevate their success. By mastering its components and implementing effective strategies, you can navigate the complexities of the foreign exchange market with confidence. Remember to start with the basics, practice, and gradually incorporate advanced techniques to harness the full potential of this remarkable indicator. The Ichimoku Cloud is more than a technical tool; it’s a guiding star that can lead you to forex trading success.

    Click here to read our latest article on Position Trading Strategies

    1. What is the Ichimoku Cloud Indicator, and how does it work? Answer: The Ichimoku Cloud Indicator, also known as Ichimoku Kinko Hyo, is a multifaceted technical analysis tool used in forex trading. It offers a holistic view of market trends by considering components such as Tenkan Sen, Kijun Sen, Senkou Span, and Chikou Span. These components provide insights into price momentum, support/resistance, and trend identification.
    2. How can the Ichimoku Cloud help me identify trends in the forex market? Answer: The Ichimoku Cloud is excellent at identifying trends. In a bullish trend, the price is above the Kumo (cloud), and both Senkou Span A and Senkou Span B point upwards. In a bearish trend, the price is below the Kumo, and both Senkou Span A and Senkou Span B slope downwards. In a sideways market, the price moves within the Kumo, and Senkou Span A and Senkou Span B are flat.
    3. What is the significance of the Kumo (cloud) in Ichimoku analysis? Answer: The Kumo serves as dynamic support and resistance levels in Ichimoku analysis. When the price is above the Kumo, it acts as a support level, and when the price is below, it becomes a resistance level. Traders often use the Kumo to identify potential areas for entry, exit, and stop-loss placement.
    4. How do I use the Tenkan Sen and Kijun Sen crossovers for trading signals? Answer: A bullish signal occurs when Tenkan Sen crosses above Kijun Sen, indicating a potential upward trend. Conversely, a bearish signal occurs when Tenkan Sen crosses below Kijun Sen, suggesting a potential downward trend. Traders use these crossovers to make informed entry and exit decisions.
    5. What role does the Chikou Span play in Ichimoku analysis? Answer: The Chikou Span, or Lagging Span, provides insights into historical price action. Its position relative to past price action can help identify potential trend reversals. Traders often use Chikou Span to confirm signals generated by other Ichimoku components.
    6. Are there specific trading strategies that can be applied with the Ichimoku Cloud? Answer: Yes, several trading strategies can be implemented with the Ichimoku Cloud. These include trend following, Kumo breakout, and Senkou Span cross strategies. Each strategy is designed to capitalize on different aspects of the Ichimoku components.
    7. What are some common mistakes to avoid when using the Ichimoku Cloud Indicator? Answer: Common mistakes include overcomplicating strategies by using too many indicators, neglecting risk management techniques, and failing to consider the broader market context and economic events alongside Ichimoku signals.
    8. Are there advanced techniques for experienced traders using the Ichimoku Cloud? Answer: Experienced traders can explore advanced techniques such as multiple timeframe analysis, customized settings for Ichimoku components, and combining Ichimoku with other technical indicators to create more robust trading strategies.
    9. What are the primary benefits of using the Ichimoku Cloud Indicator? Answer: The Ichimoku Cloud provides a holistic view of market trends, offers clear entry and exit signals, acts as dynamic support and resistance levels, and is suitable for various timeframes and currency pairs.
    10. What are the limitations of the Ichimoku Cloud Indicator? Answer: Limitations include a learning curve for beginners, potential conflicting signals in ranging markets, and the need to use it alongside other analysis techniques since it’s not a standalone solution for trading decisions.
  • Discover Expert Position Trading Strategies: Leverage Time-Tested Techniques for Sustained Achievement

    Discover Expert Position Trading Strategies: Leverage Time-Tested Techniques for Sustained Achievement

    Position trading stands as a prominent strategy in the investment sector, renowned for its emphasis on a long-term outlook. This approach seeks to profit from major market trends over prolonged periods, distinguishing itself from the quick-paced techniques of day and swing trading. In position trading, the time frame for trades extends beyond days and hours, often covering weeks, months, or even years. This strategy appeals to investors who prefer a more profound market engagement, focusing on fundamental market changes rather than fleeting price movements.

    The essence of position trading strategies lies in predicting and capitalizing on long-term market directions. This contrasts with short-term trading, which primarily relies on technical analysis. Position trading involves a thorough comprehension of fundamental market elements, incorporating detailed assessments of economic indicators, overarching market directions, and the impact of global political events on currency and stock values. The effectiveness of a position trader is rooted in their skill to foresee how these broad economic and political developments will influence long-term market trends.

    Additionally, position trading demands a unique psychological approach. It requires immense patience and discipline, as practitioners must avoid knee-jerk reactions to transient market variations. In this trading style, the focus shifts from the frequency of trading to the strategic quality and timing of entering and exiting the market. This necessitates a forward-thinking mindset and a commitment level that is usually not required in shorter-term trading methodologies. This approach integrates key elements like long-term trading analysis, risk management in position trading, trend-following techniques, and the use of economic indicators for effective trading.

    Position trading is a standout strategy in financial trading, characterized by a focus on leveraging long-term market trends. Unlike strategies that thrive on minor daily market changes, position trading is about grasping and forecasting substantial shifts over longer durations. It suits those who either have or aim to cultivate a mix of patience, strategic insight, and a profound grasp of market basics.

    At its heart, position trading is grounded in analyzing long-term market trends. Traders in this domain dedicate their efforts to understanding market movements over extended periods, often spanning months or years, rather than concentrating on short-lived hourly or daily price fluctuations.

    This method typically entails a comprehensive study of market cycles, long-term trading analysis, and economic trends. Here, the focus shifts from short-term market gyrations to the more significant, underlying forces shaping the market.

    Fundamental analysis is a cornerstone of position trading. This involves an exhaustive study of economic indicators, financial reports, industry trends, and other macroeconomic elements that can sway market trends.

    Position traders prioritize fundamental analysis over technical analysis, unlike their short-term counterparts. They delve into the intrinsic worth of assets, whether they be securities, currencies, or commodities, seeking to comprehend their true value and how external factors might impact them in the future.

    Position trading is not suited for the quick-tempered. It’s a strategy for the long-term player, with trades that might span several months or years.

    This style demands exceptional discipline and patience, as position traders must resist reacting to inconsequential market noises that don’t impact their long-term strategy.

    Additionally, strategic foresight is vital. Position traders need to anticipate future market trends and devise strategies to take advantage of these forecasts.

    Position trading diverges from the immediate decision-making and constant market surveillance required in day trading or swing trading. It allows for a more deliberative and less impulsive approach to trading decisions.

    This long-term perspective often results in reduced stress and lower transaction costs, as trading frequency is markedly less than in short-term trading tactics.

    In conclusion, the defining features of position trading strategies include an extensive understanding of long-term market trends, a substantial focus on fundamental analysis, and the qualities of patience and strategic foresight. These characteristics make position trading a distinct and potentially lucrative method for investors interested in a more profound engagement with financial markets, beyond a short-term viewpoint.

    Position trading, a method focused on long-term market participation, presents both distinct benefits and inherent challenges. It stands out for the opportunity to reap significant rewards from major market changes, yet it also necessitates considerable knowledge and resources to navigate market intricacies effectively.

    1. Opportunity for Major Gains: A key allure of position trading is the potential to achieve substantial returns from significant market trends. By maintaining positions for a longer duration, traders can tap into large-scale movements that might be overlooked in shorter-term trading.
    2. Reduced Daily Market Pressure: Unlike day traders, position traders are not tied to the daily fluctuations of the market. This results in less frequent trading and a reduction in the need to constantly monitor short-term market changes, potentially offering a more relaxed trading experience.
    3. Advantage of Economic Cycles: By employing long-term trading analysis and tracking economic indicators, position traders can make well-informed decisions that capitalize on broader economic patterns and cycles.
    4. Lower Transaction Costs: With fewer trades over time, position trading often leads to reduced transaction costs compared to strategies like day trading, potentially boosting overall profits.
    1. Need for More Capital: Position trading often requires more capital to effectively manage the risks and market fluctuations that can occur over longer periods, compared to short-term trading methods.
    2. Patience Through Market Ups and Downs: This strategy demands significant patience, as traders need to remain steadfast through various phases of market volatility, adhering to their long-term plans.
    3. Depth of Market Knowledge Required: Successful position trading requires a deep understanding of market fundamentals, including economic trends and long-term market dynamics. Acquiring this expertise can be time-consuming and challenging, especially for beginners.
    4. Risk of Larger Losses: Although there’s a potential for high returns, the risk of considerable losses is also present, particularly if long-held market positions move unfavorably.

    Overall, position trading provides a more measured, long-term approach to trading, offering chances for significant profits. However, it demands substantial capital, patience, and a comprehensive grasp of market fundamentals. Traders must carefully consider these aspects to determine if position trading aligns with their financial objectives, risk tolerance, and trading approach.

    Position trading, recognized for its emphasis on long-term market participation, involves several strategies to maximize gains from major market shifts. While primarily based on fundamental analysis, technical analysis is equally crucial, especially for pinpointing optimal entry and exit points. This overview delves into some pivotal position trading strategies: trend following, range trading, and breakout trading.

    1. Essence and Implementation: A widely used strategy in position trading, trend following entails tracking and leveraging established market trends over substantial periods. This method operates on the principle that markets often move in discernible trends, allowing traders to profit by riding these trends until signs of reversal emerge.
    2. Role of Technical Analysis: Fundamental analysis may help identify overarching trends, but technical tools like long-term moving averages, trend lines, and momentum indicators are pivotal in validating these trends and fine-tuning entry and exit strategies.
    3. Advanced Techniques: Experienced trend followers in position trading typically investigate the underlying factors driving these trends, such as macroeconomic changes or industry-specific developments. This might include examining economic indicators or gauging market sentiment to understand trend sustainability.
    4. Technical Enhancements: Tools such as the Moving Average Convergence Divergence (MACD) or Ichimoku Clouds are often employed to bolster trend-following tactics. These instruments aid in gauging trend strength and potential exhaustion points, offering refined signals for entering or exiting trades.
    1. Fundamentals and Application: Range trading is a strategy employed in sideways or consolidating markets. Here, traders define and operate within the high and low price bounds (support and resistance levels).
    2. Use of Technical Indicators: Instruments like Bollinger Bands or oscillators such as the Relative Strength Index (RSI) are crucial in spotting overbought or oversold conditions within a range, aiding in trade decisions.
    3. Strategic Insights: Success in range trading hinges on accurately identifying periods of market consolidation. Understanding the reasons behind a market’s range-bound movement is key, whether due to a lack of significant economic catalysts or general market uncertainty.
    4. Advanced Technical Instruments: Besides Bollinger Bands and RSI, Fibonacci retracement levels are often employed in range trading. These levels assist in pinpointing potential reversal points within the range, enhancing the precision of trade entries and exits.
    1. Introduction and Strategy: Breakout trading revolves around initiating a trade as soon as the price exits a defined range. The underlying assumption is that once a price exits a range, it will likely continue in that direction.
    2. Importance of Technical Analysis: Patterns like triangles, flags, and wedges are crucial for identifying potential breakouts. Volume indicators are also significant in validating breakout strength.
    3. Differentiating Real Breakouts: A major challenge in breakout trading is discerning genuine breakouts from false alarms. This requires an understanding of the broader market context, such as key economic events or sector-specific news, which might drive an authentic breakout.
    4. Volume Analysis and Patterns: Analyzing trading volume is critical in confirming breakouts. A real breakout is often accompanied by a surge in volume, reinforcing the movement’s legitimacy. Additionally, advanced chart patterns, like ascending or descending triangles, can provide insights into potential breakouts, offering more dependable trading signals.
    Position Trading Strategies

    While fundamental analysis is at the heart of position trading, the strategies outlined underscore the significance of technical analysis in the execution of long-term trades. Technical indicators and chart patterns are crucial in gauging market sentiment and tracking price dynamics, thereby assisting position traders in making more knowledgeable decisions regarding their trades.

    To sum up, an efficacious approach to position trading typically integrates fundamental and technical analysis. Fundamental analysis is instrumental in discerning the overarching market direction, while technical analysis is key to identifying optimal entry and exit points. Mastering and applying these strategies effectively can markedly improve a trader’s capacity to benefit from long-term market trends.

    In position trading, where trades often extend over long durations and encounter various market cycles, risk management is crucial. It’s not just a part of the strategy; it is its central element. Effective risk management is key in protecting investments and ensuring the sustained success of a trading career. For position traders, this includes implementing well-considered stop-loss orders, maintaining favorable risk-reward ratios, and strategically diversifying the trading portfolio.

    1. Essential Role: Stop-loss orders are vital for position traders. They serve to cap potential losses on a position. Given the extended duration of trades and the possibility of significant market shifts, a strategically placed stop-loss order can avert severe financial setbacks.
    2. Strategic Implementation: In position trading, the placement of stop-loss orders requires an understanding of market volatility and the overarching trading strategy. Typically, they are set at points that allow for some market fluctuation while still shielding from unacceptable losses.
    1. Importance of Balance: In position trading, maintaining a sound risk-reward ratio is crucial. Traders need to weigh the potential gains of a trade against its possible risks, pursuing it only if the expected rewards outweigh the risks.
    2. Long-Term Focus: This risk-reward evaluation adopts a long-term view in position trading. Traders consider not just the immediate potential of a trade but its long-term prospects over weeks, months, or years.
    1. Risk Mitigation: Diversification is a critical element of risk management in position trading. By spreading investments across various assets or markets, traders can diminish the effect of any single market event on their overall portfolio.
    2. Holistic Approach: Effective portfolio diversification in position trading might involve investing in a variety of asset classes, sectors, and geographical regions. This approach is particularly significant in position trading due to the prolonged nature of trades, which can expose traders to a broader spectrum of risks.

    In summary, integrating these risk management techniques is vital for position traders. The nature of their long-term trades, combined with the complex market dynamics, underscores the necessity of a robust risk management plan. This plan should not only aim to protect capital from individual trade risks but also safeguard the entire trading portfolio against market volatility and unforeseen events.

    Position traders, known for their long-term market engagement, rely heavily on specific tools and indicators for successful trading. These resources are essential not just for spotting and confirming long-term trends, but also for insights into the market’s current state and likely future trajectory. Key tools and indicators for position traders include extended moving averages, support and resistance levels, and a range of economic indicators.

    1. Function in Trend Assessment: Extended moving averages, such as the 50-day, 100-day, or 200-day averages, are fundamental in discerning the prevailing market trend. By smoothing out short-term price variations, these averages offer a more lucid view of the long-term market direction.
    2. Tactical Application: Position traders frequently use these averages to decide when to enter or leave a market. A common strategy might involve initiating a trade when the price of an asset surpasses a significant moving average and exiting as it dips below.
    1. Determining Crucial Price Points: Support and resistance levels are key for identifying potential turning points in an asset’s price journey. These levels are established based on historical prices where a security has consistently found support or faced resistance.
    2. Influencing Long-Term Trade Choices: These levels are particularly useful for position traders in predicting areas where prices might reverse or break out, thereby informing long-term trading strategies.
    Position Trading Strategies
    1. Assessing Economic and Market Health: Economic indicators are vital for evaluating the broader health of the economy and forecasting market directions. Indicators such as GDP growth rates, employment data, inflation figures, and manufacturing indices are commonly used.
    2. Impacting Market Movements: Position traders utilize these indicators to anticipate shifts in market sentiment and economic trends. For example, a robust employment report could indicate an improving economy, prompting a trader to adopt a bullish stance on market indices or specific sectors.

    For any position trader, these tools and indicators are essential elements of their trading arsenal. When used effectively, they enable a deeper comprehension of market trends and facilitate more informed, long-term trading decisions. Nevertheless, it’s critical to employ these tools alongside a thorough analysis of market conditions and a robust grasp of economic fundamentals for optimal effectiveness.

    The practical application of position trading becomes more tangible when explored through actual cases and real-world scenarios. Examining both triumphs and challenges in position trading can offer invaluable lessons and insights. Here, we delve into a prominent example of a successful position trading venture and a situation where a position trading approach faced difficulties.

    1. Case Summary: A notable instance of effective position trading is observed in the technology sector’s boom during the late 2010s. Traders who foresaw the enduring growth in tech companies, particularly giants like Apple and Amazon, were poised for significant gains.
    2. Implementation of Strategy: In this context, position traders may have taken long positions in these tech stocks, grounding their decision on the fundamental analysis of the sector’s burgeoning potential, fueled by technological advancements and a shift in consumer preferences towards digital solutions.
    3. Result: Traders who held onto their positions across several years witnessed impressive returns, as stock prices of companies like Apple and Amazon escalated, validating the power of a thoroughly researched position trading strategy in harnessing major market trends.
    1. Event Overview: An illustrative counterexample is the downturn in the oil market from 2014 to 2016. Contrary to many forecasts of stable or increasing oil prices, the market underwent a significant slump, driven by an oversupply of oil globally and various geopolitical influences.
    2. Challenges for Position Traders: Traders with long-term stakes in oil or energy stocks, anticipating upward price trends, encountered substantial hurdles. This instance accentuates the inherent risks in position trading, where unforeseen external factors can dramatically shift market dynamics.
    3. Learning Points: This scenario emphasizes the criticality of diversification in position trading and the continuous need to reassess market conditions. It highlights the market’s volatility and the potential limits of fundamental analysis in foreseeing market movements.

    These instances illustrate the contrasting aspects of position trading. The success story in the tech sector demonstrates how recognizing and persisting with long-term trends can yield significant rewards. Conversely, the downturn in the oil market acts as a reminder of the necessity for ongoing market analysis and the implementation of risk management strategies in long-term trading.

    Position trading, known for its potential to yield substantial returns, also entails a set of distinct challenges. These arise from the market’s inherent unpredictability, economic shifts, and the psychological demands of sustaining long-term investments. Recognizing and addressing these challenges is vital for traders aspiring to excel in position trading.

    1. Coping with Market Fluctuations: Position traders are required to endure periods of intense market volatility. Unlike their short-term counterparts, they can’t swiftly exit positions in reaction to abrupt market changes, necessitating resilience against temporary market dips and a non-impulsive approach.
    2. Impact of Economic Shifts: Changes in the economic landscape, including recessions, political turbulence, or shifts in monetary policies, can profoundly affect long-term market trajectories. It’s imperative for position traders to adeptly modify their strategies to align with these macroeconomic changes.
    1. Need for Patience and Steadfastness: Holding positions over extended durations demands significant patience and a disciplined mindset. The psychological strain of witnessing fluctuations in open positions, occasionally negative, over long periods can be strenuous.
    2. Building Emotional Fortitude: Enduring substantial market movements without the ability to react promptly can be emotionally draining. Position traders need to develop a mindset that enables them to remain composed and adhere to their strategies, even during tough market periods.
    1. Identifying Long-Term Trends: Accurately pinpointing and comprehending long-term market trends is a crucial yet challenging aspect of position trading. Misinterpretation of these trends can lead to ill-timed trade entries or exits, potentially incurring losses.
    2. Ongoing Market Observation: While position trading is less intensive than day trading, it still necessitates regular tracking of market trends and economic indicators. Neglecting to stay updated can lead to missed opportunities or prolonged holding of unprofitable positions.
    1. Requirement for Ample Capital: Position trading typically necessitates substantial capital to sustain positions through market fluctuations and to achieve effective portfolio diversification.
    2. Liquidity Considerations: With investments tied up for extended periods, position traders need to adeptly manage liquidity to ensure availability of funds for short-term necessities or unforeseen market events.

    In summary, while position trading can offer considerable rewards from long-term market movements, it comes with its unique set of challenges. Successfully navigating market unpredictability, managing the psychological aspects of long-term investments, and conducting precise trend analyses are crucial. Additionally, careful management of capital and liquidity is essential for success in the nuanced arena of position trading.

    Starting in position trading presents both opportunities and challenges, particularly for novices in this trading approach. To effectively embark on this journey, new position traders should arm themselves with essential tips and methods. This guidance highlights the importance of being well-versed in long-term market trends and underscores the need for continual education in the ever-changing trading environment.

    1. Grasping Market Influences: Initiate your trading journey with a robust understanding of fundamental analysis. Grasp how economic indicators, global happenings, and financial statements influence market directions.
    2. Long-Term Perspective: Focus on analyzing these elements from a long-term viewpoint, considering their impact on market trends over extended periods.
    1. Enhancing Trade Decisions: While fundamental analysis forms the core of position trading, integrating technical analysis can refine the timing of your trades. Get acquainted with long-term technical tools like moving averages and trend lines.
    2. Combined Approach: Cultivate an approach where fundamental analysis guides what you trade, and technical analysis dictates when you trade.
    1. Regular Market Analysis: Keep abreast of global economic developments and news. Regular consumption of financial journalism, market reports, and economic data can offer critical insights.
    2. Ongoing Learning: The financial landscape is ever-evolving. Commit to continual learning through courses, webinars, and literature to stay updated with emerging strategies and market shifts.
    1. Emotional Steadiness: Develop patience and discipline, key attributes for position traders. Recognize that meaningful gains in position trading often take time and the capacity to endure market fluctuations.
    2. Adherence to Strategy: Resist the urge to act on short-term market trends. Maintain your trading plan and approach, even during volatile market conditions.
    1. Effective Use of Stop-Loss Orders: Employ stop-loss orders to cap your risk on each transaction.
    2. Portfolio Diversification: Spread your risk by diversifying your portfolio. Avoid concentrating all your resources in a single market or sector.
    1. Start Small: Kick off your trading with a modest portfolio and escalate your market exposure as you gain confidence and expertise in position trading.
    2. Set Realistic Goals: Establish attainable objectives and expectations. Recognize that losses are a natural part of the learning curve and an inherent aspect of the trading process.

    Adhering to these guidelines can help budding position traders establish a strong foundation for a thriving trading career. Remember, position trading is akin to a long-distance race, demanding a long-term outlook, ongoing education, and a disciplined stance in market analysis and risk management.

    To sum up, position trading presents a distinct avenue for traders to interact with the market in a more calculated and extended manner. Despite its inherent challenges, acquiring a thorough comprehension of market behavior and implementing robust risk management techniques can result in notable success in trading. The purpose of this article is to provide traders with essential insights and resources necessary to proficiently navigate position trading strategies, ultimately leading to sustained success in their trading pursuits.

    Click here to read our latest article on Mastering Forex Risk Management

    1. What is Position Trading? Position trading is a strategy focused on long-term investment, where traders aim to benefit from significant market trends spanning weeks to years.
    2. How Does Position Trading Compare to Day Trading and Swing Trading? Unlike day trading, where positions are opened and closed within a single day, or swing trading that targets shorter-term trends, position trading involves holding onto positions for longer durations to leverage major market shifts.
    3. What is the Fundamental Concept of Position Trading? The core concept of position trading lies in identifying and exploiting long-term market trends, primarily through fundamental analysis, complemented by technical analysis for determining entry and exit points.
    4. What Benefits Does Position Trading Offer? Position trading allows for significant gains from substantial market changes, involves less daily trading activity, and suits individuals with busy schedules, offering a more relaxed trading approach.
    5. What are the Challenges of Position Trading? Position trading demands a considerable capital investment, requires patience to endure market volatility, and necessitates a deep understanding of market mechanisms.
    6. What Strategies are Common in Position Trading? Key strategies in position trading include trend following, range trading, and breakout trading, each tailored to capture extensive market movements.
    7. How Crucial is Risk Management in Position Trading? In position trading, risk management is essential. Traders need to apply stop-loss orders, strive for an advantageous risk-reward balance, and diversify their investments to minimize the inherent risks.
    8. Which Tools and Indicators are Vital for Position Traders? Position traders utilize tools such as long-term moving averages, support and resistance levels, and economic indicators to analyze market conditions and forecast future trends.
    9. Can Position Trading Strategies Be Seen in Real-world Examples? Indeed, real-world cases like the late 2010s’ tech sector boom demonstrate the success of position trading in capitalizing on significant market trends, offering practical insights from these strategies.
    10. Is Position Trading a Good Fit for Novice Traders? While offering potential profitability, position trading demands an understanding of market trends and patience. Beginners should build a strong foundational knowledge and start with smaller investments before fully immersing in position trading.

    Click here to learn more about Position Trading Strategies

  • Mastering Forex Risk Management: 5 Essential Strategies for Secure & Profitable Trading

    Mastering Forex Risk Management: 5 Essential Strategies for Secure & Profitable Trading

    In the dynamic world of currency trading, mastering Forex risk management is a fundamental skill that every trader must acquire for achieving long-term success. With the constant fluctuations in the foreign exchange market, understanding and implementing effective Forex risk management strategies becomes crucial to minimize potential losses while maximizing gains. This comprehensive guide will delve into the core aspects of Forex risk management, emphasizing the importance of position sizes, stop losses, and the risk/reward ratio in securing profitable trading outcomes.

    Forex, or foreign exchange, trading involves the buying and selling of currencies on a global scale. With its high liquidity and 24-hour market, it attracts traders from all corners of the globe. However, the same factors that make Forex trading appealing also contribute to its volatility. This is where Forex risk management plays a pivotal role, serving as a protective shield against the unpredictable nature of currency trading.

    Forex risk management is a comprehensive approach involving various practices aimed at mitigating financial risks in the volatile world of currency trading. This discipline extends beyond the mere prevention of losses; it involves strategic planning and execution of trades where the anticipated benefits outweigh the associated risks. Central to this concept is the balancing act between potential gains and potential losses, a skill that demands both knowledge and experience in the Forex market.

    At its core, Forex risk management is about understanding and managing the risks inherent in trading currencies. The foreign exchange market is known for its rapid fluctuations and can be unpredictable, influenced by global economic, political, and even social events. For a trader, this means any investment in the market carries inherent risk. Therefore, developing a strong foundation in Forex risk management is crucial for any trader looking to achieve sustainability and profitability in their trading endeavors.

    Effective Forex risk management involves several key components. Firstly, it necessitates a clear comprehension of one’s risk tolerance. Every trader has a different level of comfort with risk, and understanding this personal threshold is essential. It guides traders in determining how much they are willing to risk on each trade, a decision that should be based on rational analysis rather than emotion.

    Another critical aspect of Forex risk management is the proper calculation and application of position sizes. Position sizing is a strategy that helps in managing the amount of risk taken in each trade. By carefully determining the size of a position relative to the account balance, traders can ensure that they do not expose themselves to excessive risk, thereby safeguarding their capital. This strategy is pivotal in preserving a trader’s capital over the long term, allowing them to remain active in the market even after a series of losing trades.

    Furthermore, the use of stop losses is an integral part of Forex risk management. A stop loss is an order placed with a broker to sell a security when it reaches a certain price. It is designed to limit a trader’s loss on a position in a security. Setting effective stop losses ensures that traders can cap their losses at an acceptable level, preventing a single trade from causing significant damage to their trading account. The skillful use of stop losses can be the difference between a manageable loss and a catastrophic one, thus playing a crucial role in risk management.

    In addition to these technical aspects, Forex risk management also involves a psychological dimension. The ability to control emotions and maintain discipline in trading decisions is vital. Emotional decisions can lead to impulsive trading without proper risk assessment, undermining the principles of sound risk management.

    The cornerstone of effective Forex risk management is understanding and assessing one’s risk appetite. Risk appetite refers to the amount of risk a trader is comfortable taking on in their currency trading activities. This is a deeply personal consideration and varies widely among individuals, influenced by factors such as trading experience, capital size, and personal financial goals.

    Importance of Knowing Your Risk Threshold:
    Knowing your risk threshold is imperative in Forex risk management. It’s about self-awareness, understanding your own financial situation, and recognizing the level of stress you are willing to tolerate. This understanding guides traders in making decisions that align with their comfort levels. For instance, a conservative trader might avoid highly volatile currency pairs, while a more aggressive trader might seek them out for the potential of higher returns. This self-knowledge not only aids in selecting appropriate trades but also in setting realistic expectations for the outcomes of those trades.

    Risk appetite significantly impacts how a trader reacts to gains and losses. A trader who understands their risk tolerance is less likely to make emotional decisions, such as chasing losses or becoming overconfident after a win. This emotional stability is key to maintaining a long-term presence in the Forex market.

    Calculating Acceptable Risk Per Trade:
    To maintain a balanced approach in Forex trading, it’s crucial to calculate an acceptable level of risk per trade. The commonly advised range is not to risk more than 1-3% of your trading capital on a single trade. This percentage serves as a guideline to help traders manage their capital effectively and avoid the danger of wiping out their account with a few bad trades.

    For example, if a trader has a capital of $10,000 and decides to risk 2% per trade, the maximum they would risk on a single trade is $200. This disciplined approach to risk management ensures that the trader can withstand a string of losses without depleting their trading capital significantly. This method also helps in fostering a more measured approach to trading, encouraging traders to seek out higher quality trades rather than making impulsive decisions.

    Moreover, by limiting the risk per trade, traders can ensure a more consistent performance. A series of small losses can be recovered more easily than a single, significant loss. This approach aligns with the philosophy of preserving capital as the primary goal in Forex trading, where the key to success is not just in making profits, but more importantly, in minimizing losses.

    In the realm of Forex risk management, position sizing stands out as a fundamental strategy. It refers to the process of determining the appropriate amount of currency units to buy or sell in a trade. The significance of position sizing lies in its direct impact on the risk level of each trade, and consequently, on the overall health of the trading account.

    Determining the Right Position Size:
    The right position size in Forex trading is not a one-size-fits-all figure; it varies from trader to trader, depending on individual risk tolerance and account size. Calculating the right position size involves a careful assessment of how much risk you are willing to take on a particular trade, in alignment with your overall trading strategy and goals.

    For instance, a trader with a larger account may feel comfortable taking on a bigger position size, while a trader with a smaller account may prefer to trade smaller position sizes to mitigate risk. Additionally, the volatility of the currency pair being traded also plays a crucial role in determining position size. Highly volatile pairs may warrant smaller position sizes due to the increased risk of large price movements.

    A practical approach to determining position size is to use a risk management calculator. These calculators take into account your account size, risk percentage per trade, stop loss size, and currency pair to compute the ideal position size. This methodical approach ensures that each trade is aligned with your predefined risk parameters, thereby safeguarding your account from excessive exposure.

    Relationship Between Position Size and Risk Management:
    The relationship between position size and risk management is direct and significant. Essentially, the larger the position size, the greater the financial impact of a price movement in or against your favor. Therefore, it is imperative to adjust your position size according to the level of risk associated with each trade.

    A trader employing larger position sizes increases their exposure to market volatility, thereby amplifying both potential profits and losses. On the other hand, smaller position sizes reduce potential gains but also limit losses, making them a more conservative approach to risk management. The key is to find a balance that aligns with your risk tolerance and trading strategy.

    Position sizing is not only about limiting losses but also about optimizing potential gains. Properly sized positions ensure that traders do not miss out on profitable opportunities due to overly conservative sizing, nor do they expose themselves to unsustainable losses with overly aggressive sizing.

    In the intricate landscape of Forex trading, the use of stop losses is a crucial aspect of a robust Forex risk management strategy. Stop losses are essentially automated instructions set within a trading platform to exit a position at a specified price, thereby capping potential losses on a trade. Their strategic use is integral in safeguarding a trader’s capital against market volatility.

    Concept and Importance of Stop Losses:
    A stop loss is a predefined order to sell (or buy, in the case of a short position) a currency pair once it reaches a certain price, effectively stopping further losses. This tool is invaluable in Forex risk management as it provides a safety net, preventing a bad trade from spiraling into a disastrous financial setback. In the fast-paced Forex market, where currency values can fluctuate dramatically in a short period, stop losses ensure that traders are not overly exposed to unfavorable market movements.

    The importance of stop losses in Forex trading cannot be overstated. They provide a measure of security and control, allowing traders to determine in advance the maximum amount they are willing to lose on a trade. This proactive approach to risk management enables traders to maintain a clear head and focus on their trading strategy, rather than being overwhelmed by emotional reactions to market movements.

    Forex Risk Management.

    Setting Effective Stop Loss Points:
    The effectiveness of a stop loss largely depends on its placement. Setting a stop loss is not a random decision but should be based on a thoughtful analysis of market conditions and the specific parameters of the trade. The ideal placement of a stop loss is at a point where the initial reasoning behind the trade is no longer valid.

    For instance, if a trade is based on a particular technical pattern or a support/resistance level, the stop loss should be set at a point where this pattern or level is invalidated. This approach ensures that if the market moves against the trade, the position is exited before the loss becomes significant.

    Another consideration in setting stop losses is the volatility of the currency pair being traded. Highly volatile pairs might require wider stop losses to accommodate normal price fluctuations, whereas less volatile pairs can have tighter stops. It’s also important to consider the trader’s risk tolerance and account size when setting stop losses. Traders with a lower risk tolerance or smaller account size might prefer tighter stop losses to quickly exit losing trades and preserve capital.

    Additionally, stop losses should be dynamic and adjusted according to changing market conditions. As a trade moves in a favorable direction, a trader might move the stop loss to a break-even point or use a trailing stop loss to lock in profits while still giving the trade room to grow.

    Leverage is a double-edged sword in the world of Forex trading, capable of dramatically increasing both potential profits and potential losses. Understanding and managing leverage is, therefore, a crucial aspect of Forex risk management, essential for both novice and experienced traders alike.

    Understanding Leverage in Forex Trading:
    Leverage in Forex trading refers to the use of borrowed capital to increase the potential return of an investment. It allows traders to open larger positions than their actual capital would otherwise permit. For example, with a leverage of 50:1, a trader with an account balance of $1,000 can hold a position that is worth $50,000. This amplification of trading capacity is one of the most attractive features of Forex trading, providing the opportunity for significant profits from relatively small price movements.

    However, the use of leverage also magnifies the risk of losses. Just as it can increase profits on successful trades, it can equally escalate losses on unsuccessful ones. Therefore, understanding the implications of leverage is a fundamental part of Forex risk management. Traders need to be aware that while leverage can boost their trading power, it can also expose them to higher levels of risk.

    Managing Risks with Leverage:
    The management of leverage is a key skill in Forex risk management. One primary recommendation, especially for beginner traders, is to use lower levels of leverage. Lower leverage reduces the risk exposure, as it lessens the potential size of losses. New traders, in particular, may not have the experience to navigate the complexities of highly leveraged trades and can benefit from a more cautious approach.

    Moreover, managing risks with leverage involves not just choosing an appropriate level of leverage but also understanding the market conditions and the specific trade. In highly volatile market conditions, even moderate leverage can result in significant losses. Traders must, therefore, adjust their leverage based on current market volatility and their own risk tolerance.

    Another aspect of managing risks with leverage is to maintain an adequate level of margin. Margin is the amount of capital required to hold a leveraged position. A common mistake among traders is to use too much of their capital as margin, leaving little room to absorb losses. Ensuring that only a portion of the capital is used as margin can protect traders from margin calls, which occur when the account balance falls below the required margin level.

    Traders should also employ other Forex risk management strategies in conjunction with leverage management. These include using stop losses to limit potential losses, employing proper position sizing, and maintaining a disciplined approach to trading.

    The risk/reward ratio is a critical concept in Forex risk management, serving as a key metric to evaluate the viability and potential profitability of trades. Understanding and effectively utilizing risk/reward ratios can significantly influence a trader’s success in the Forex market.

    Calculating and Using Risk/Reward Ratios:
    The risk/reward ratio measures the potential profit of a trade against its potential risk. It is calculated by dividing the amount of potential loss (if the stop loss is hit) by the potential profit (if the target price is reached). For instance, if a trader sets a stop loss at $100 below the entry point and a profit target at $300 above the entry point, the risk/reward ratio is 1:3. This means that for every dollar risked, the potential reward is three dollars.

    A favorable risk/reward ratio is generally considered to be 1:3 or higher. This ratio indicates a trade where the potential returns significantly outweigh the risks. However, the desired ratio can vary based on individual trading strategies and market conditions. Some traders might accept a lower ratio in highly probable trades, while others might seek a higher ratio in trades with lower probability but higher potential returns.

    Calculating and adhering to a favorable risk/reward ratio is essential in Forex risk management. It ensures that traders do not enter trades where the potential risk outweighs the potential gain. By consistently applying this principle, traders can make more informed and disciplined trading decisions.

    Impact of Risk/Reward Ratios on Trading Decisions:
    The implementation of risk/reward ratios has a profound impact on trading decisions and overall trading strategy. A sound Forex risk management strategy involves selecting trades that offer a high risk/reward ratio. This approach ensures that the profits from successful trades can offset the losses from unsuccessful ones, leading to overall profitability in the long term.

    For example, if a trader wins only 40% of their trades but follows a 1:3 risk/reward ratio, they will still be profitable. This is because the wins will be significantly larger than the losses. Such a strategy reduces the pressure on traders to have a high win rate, allowing them to focus on the quality of their trades rather than the quantity.

    Moreover, focusing on risk/reward ratios encourages traders to think critically about their stop loss and take profit levels. It forces traders to consider the realistic potential of a trade and set their exit points accordingly. This disciplined approach to setting stop losses and profit targets is integral to successful Forex risk management.

    The psychological component of Forex trading, particularly in how emotions impact trading decisions, is a critical aspect of Forex risk management. The ability to manage emotions and maintain objectivity can significantly affect a trader’s success in the volatile world of currency trading.

    Role of Emotions in Trading Decisions:
    Emotional control is a vital skill in Forex trading. The high-stakes, fast-paced nature of the Forex market can often lead to intense emotional responses, which can cloud judgment and lead to impulsive decisions. Emotions like fear can cause a trader to exit a position too early, missing out on potential gains, or greed can lead them to hold onto a losing position for too long in the hope of a turnaround.

    Fear, greed, overconfidence, and hope are common emotions that traders grapple with. Each of these can skew perception and lead to trading choices that deviate from a well-thought-out strategy. These emotional responses can be particularly detrimental in Forex risk management, as they can lead to increased and unnecessary risk-taking or, conversely, to excessive caution that stifles potential profitable opportunities.

    Strategies to Maintain Objectivity:
    Maintaining objectivity in trading decisions is crucial for effective Forex risk management. Several strategies can be employed to minimize the influence of emotions on trading:

    1. Keeping a Trading Journal: A trading journal is an invaluable tool for a Forex trader. It involves recording details about trades, including the rationale behind each decision, the outcomes, and any emotional responses felt during the trade. Reviewing this journal can help traders identify patterns in their emotional responses and decision-making, allowing them to learn from past experiences and avoid making the same mistakes in the future.
    2. Following a Strict Trading Plan: A trading plan is a set of guidelines that dictates when to enter or exit trades, how much capital to risk, and how to manage trades. This plan should be based on thorough research and a clear understanding of the market and personal trading style. Sticking to a trading plan can help traders avoid making impulsive decisions based on short-term emotional reactions.
    3. Setting Predefined Rules: Predefined rules are specific criteria or conditions that must be met before executing a trade. These rules can include specific market conditions, entry and exit points, stop-loss orders, and risk/reward ratios. By adhering to these rules, traders can ensure that their decisions are based on logical analysis and strategy rather than on fleeting emotions.
    4. Practicing Mindfulness and Emotional Awareness: Being aware of one’s emotional state and practicing mindfulness can also aid in maintaining objectivity. This self-awareness enables traders to recognize when their emotions might be influencing their decisions and to take a step back to reassess the situation more objectively.

    The implementation of a comprehensive Forex risk management plan is a critical step towards achieving consistent and long-term success in currency trading. This plan serves as a blueprint, guiding traders through the complexities of the Forex market with a structured approach to managing risk.

    Creating a Comprehensive Plan:
    A well-devised Forex risk management plan encompasses a range of key components, each tailored to the individual trader’s style, objectives, and risk tolerance. The plan should be detailed and cover various aspects of trading, including but not limited to:

    1. Rules for Position Sizing: The plan should specify how to determine the size of each trade based on the trader’s account size and risk tolerance. This includes setting parameters for the maximum percentage of capital to be risked on a single trade and how to adjust position sizes in response to changing market conditions or account balance fluctuations.
    2. Guidelines for Setting Stop Losses: Establishing rules for where and how to place stop-loss orders is crucial. This should be based on technical and fundamental analysis to ensure that stop losses protect against undue losses while allowing enough room for normal market fluctuations.
    3. Leverage Usage: The plan should clearly state the maximum leverage to be used in trades. Setting a cap on leverage can help prevent excessive risk-taking, especially in highly volatile market conditions.
    4. Adherence to the Risk/Reward Ratio: The plan should include guidelines for identifying trades with a favorable risk/reward ratio, ensuring that potential rewards justify the risks involved. This might involve setting a minimum acceptable risk/reward ratio for entering a trade.

    In addition, the plan can also encompass guidelines for handling various market scenarios, criteria for trade entry and exit, and tactics for dealing with psychological aspects like emotional responses to losses or gains.

    Incorporating the Plan into Daily Trading:
    The effectiveness of a Forex risk management plan lies in its consistent application. Incorporating the plan into daily trading activities requires discipline and commitment. Traders should review their risk management plan regularly, ideally before each trading session, to ensure all decisions align with the established guidelines.

    Consistency in applying the risk management plan can lead to the development of positive trading habits. It helps in minimizing impulsive and emotional decisions and fosters a more analytical and objective approach to trading. Over time, this consistency can significantly improve a trader’s ability to manage risks effectively, leading to more stable and profitable trading outcomes.

    Moreover, incorporating the plan into daily trading allows traders to adapt their strategies to the ever-changing Forex market. Regularly reviewing and updating the risk management plan in response to personal trading experiences, changes in market conditions, and evolving financial goals is crucial. This ongoing process helps traders stay aligned with best practices in risk management and enhances their ability to navigate the Forex market successfully.

    As we conclude this comprehensive exploration of Forex risk management, it’s imperative to underscore the pivotal role that effective risk management plays in the realm of currency trading. The strategies and principles discussed – from judicious position sizing to the prudent use of stop losses and the careful consideration of risk/reward ratios – are more than mere tactics; they are fundamental elements that constitute the bedrock of a successful Forex trading career.

    The importance of Forex risk management cannot be overstated. It is the key factor that separates the seasoned trader from the novice. While the allure of quick profits can be tempting, it’s the consistent application of risk management principles that ensures long-term sustainability in the Forex market. This discipline helps traders navigate through the turbulent waters of market volatility and uncertainty, safeguarding their capital and their trading future.

    It is crucial to recognize that effective Forex risk management is not a static skill but a dynamic one that evolves with experience and continuous learning. The Forex market is ever-changing, and so should be the strategies and approaches of the trader. Continuous education, self-reflection, and adaptation to new market realities are integral to staying relevant and profitable in the world of currency trading.

    Click here to read our latest article on Discover Advanced Forex Trading

    1. What is Forex Risk Management?
      Forex risk management is the practice of identifying, analyzing, and mitigating the risks involved in currency trading to protect your investment.
    2. Why is position sizing important in Forex trading?
      Position sizing is crucial as it determines the amount of capital risked per trade, helping to manage and limit potential losses in line with your risk tolerance.
    3. How do stop losses contribute to Forex risk management?
      Stop losses help control potential losses by automatically closing a trade at a predetermined level, preventing larger, unmanageable losses.
    4. What is a favorable risk/reward ratio in Forex trading?
      A favorable risk/reward ratio is typically 1:3 or higher, meaning the potential profit of a trade is at least three times the potential risk.
    5. Can leveraging increase risks in Forex trading?
      Yes, leveraging can increase risks as it allows for controlling larger positions with less capital, amplifying both potential profits and losses.
    6. How can a Forex trader manage emotional decisions?
      Traders can manage emotional decisions by maintaining a trading journal, following a strict trading plan, and setting predefined rules to stay objective.
    7. What should a comprehensive Forex risk management plan include?
      A comprehensive plan should include guidelines for position sizing, stop losses, leverage usage, and adherence to risk/reward ratios.
    8. How often should a Forex risk management plan be reviewed?
      A Forex risk management plan should be regularly reviewed and adjusted if necessary, especially in response to changing market conditions or trading performance.
    9. What is the role of continuous learning in Forex risk management?
      Continuous learning is vital in adapting to the dynamic Forex market, refining strategies, and staying informed about new risk management techniques.
    10. Is it possible to be profitable in Forex trading with a low win rate?
      Yes, with a strong risk/reward ratio strategy, it’s possible to be profitable even with a low win rate, as winning trades can compensate for losing ones.

    Click here learn more about Forex Risk Management

  • Discover Advanced Forex Trading with These 5 Strategies: Transform Your Portfolio with Confident Mastery!

    Discover Advanced Forex Trading with These 5 Strategies: Transform Your Portfolio with Confident Mastery!

    Are you ready to dive into the world of Advanced Forex Trading? If you’re looking to elevate your forex trading game and achieve a level of mastery that can help you navigate the ever-volatile foreign exchange market with confidence, you’ve come to the right place. In this comprehensive guide, we will explore the intricacies of Advanced Forex Trading, focusing on strategies, techniques, and tools that can empower you to transform your portfolio and become a more successful forex trader.

    What is Forex Trading?

    Let’s start with the basics. At its core, forex trading, or foreign exchange trading, represents an intricate dance within the global financial marketplace. It’s the art of engaging in a constant flux of buying and selling currency pairs. While on the surface, it may seem like a straightforward exchange of one currency for another, it’s far more nuanced than that. Forex trading is a dynamic arena where traders strive to capitalize on the ever-shifting price movements of currencies to achieve profitability.

    The Essence of Currency Pairs: In the world of forex, the concept of currency pairs lies at the heart of every trade. A currency pair, as the name suggests, involves two distinct currencies, each playing a unique role. These currencies are divided into two categories: the base currency and the quote currency. Let’s illustrate this with a classic example.

    Consider the EUR/USD pair. In this case, the Euro (EUR) is the designated base currency, and the US Dollar (USD) takes on the role of the quote currency. The choice to buy or sell this forex pair hinges on your expectations regarding the relative strength of these two currencies.

    Buy or Sell: When you decide to buy the EUR/USD pair, you are essentially expressing your belief that the base currency (EUR) will appreciate in value compared to the quote currency (USD). It’s akin to saying, “I expect the Euro to strengthen against the US Dollar.” In this scenario, you anticipate that the exchange rate for EUR/USD will rise, and you aim to profit from this upward movement.

    Conversely, when you choose to sell the EUR/USD pair, you are taking the opposing view. Here, you are betting on the quote currency (USD) gaining strength relative to the base currency (EUR). In other words, you are speculating that the Euro will weaken against the US Dollar. If your prediction is accurate, you will profit from the depreciation of the EUR/USD exchange rate.

    The Crucial Foundation: These foundational concepts of forex trading—the understanding of currency pairs, base and quote currencies, and the dynamics of buying and selling—are the bedrock upon which advanced forex trading techniques are built. To excel in the world of Advanced Forex Trading, this knowledge is non-negotiable.

    Before we dive into the more intricate strategies and techniques that can help you transform your forex trading portfolio, it’s essential to ensure you have a firm grasp of these fundamental principles. They serve as your compass, guiding your decisions and actions as you navigate the complex and ever-changing terrain of the forex market. With this solid foundation, you’re well-prepared to explore the advanced strategies that can elevate your trading prowess and ultimately lead to more confident and profitable outcomes.

    5 Advanced Forex Trading Techniques

    1. Hedging Forex

    In the intricate landscape of advanced forex trading, the technique known as hedging emerges as a formidable shield, diligently guarding traders against the capricious nature of the market. It is a sophisticated maneuver employed to prudently manage and mitigate risks associated with existing forex positions. While it may not serve as a direct profit generator, hedging takes on the pivotal role of a protective measure, akin to a financial insurance policy, carefully designed to shield traders from the potential perils of market fluctuations.

    Now, let’s dive deeper into the world of forex hedging, exploring its nuances and unveiling how it can be a game-changer for seasoned traders, always seeking to navigate the complex forex seas with unwavering confidence.

    The Scenario Unfolds: Picture this: You, as a seasoned forex trader, have astutely chosen to short the USD/GBP currency pair, believing that it’s a prudent move to capitalize on a recent price range peak. Your analysis appeared sound, and you entered the trade with a sense of calculated optimism. However, as the days progress and you vigilantly monitor your trade, the unforeseen occurs—the USD/GBP pair begins to display unexpected strength, casting a looming shadow over your carefully chosen short position.

    This is the juncture where the art of forex hedging comes into play, and its significance becomes evident. At this point, you’re faced with the challenge of preserving your capital and averting potential losses. Hedging provides a strategic avenue to address this challenge.

    Creating a Hedge: The essence of hedging lies in balancing your exposure and mitigating risk. To achieve this, you can explore other USD currency pairs, such as the EUR/USD, which tend to move inversely to the USD/GBP. By strategically shorting the first currency pair (EUR/USD), in addition to your original position on USD/GBP, you establish what is known as a hedge.

    Now, let’s break down the dynamics of this hedge. If, in the unfolding market scenario, the USD does indeed strengthen against the GBP, causing your short USD/GBP trade to incur losses, your short EUR/USD trade concurrently moves into a profitable position. The inverse relationship between these currency pairs becomes your advantage. The gains realized from the EUR/USD trade effectively offset the losses incurred in the USD/GBP trade.

    It’s important to note that, initially, both positions may not necessarily yield a net profit. However, the strategic magic of timing comes into play. By judiciously monitoring the market and understanding its dynamics, you can execute your trades at precisely the right moments. This strategic synchronization allows you to navigate the forex realm with finesse, ultimately enabling you to emerge with profits, all while minimizing additional risk exposure.

    In essence, think of forex hedging as the safety net that ensures you don’t plummet into financial uncertainty when market conditions take an unexpected turn. Much like an insurance policy, it safeguards your investments and provides peace of mind in an arena known for its inherent volatility.

    In the world of advanced forex trading, where market dynamics can shift in the blink of an eye, the art of hedging emerges as a powerful and indispensable technique. While it may not be a direct source of profits, its role as a protective measure against potential losses cannot be overstated. Forex hedging empowers traders to maintain a firm grip on their financial stability, even when the market takes them on an unforeseen journey. It’s a strategic tool that, when wielded with precision and timing, can be the difference between navigating the forex seas with confidence and being at the mercy of unpredictable market forces.

    2. Position Trading

    In the realm of advanced forex trading, one technique that stands out as a testament to patience, strategy, and a long-term vision is position trading. This approach defies the fast-paced nature of the forex market and embraces a ‘buy and hold’ philosophy, with trade durations stretching from weeks to months, and even years. Position traders are characterized by their ability to maintain a steadfast position, either bullish or bearish, on one of the currencies within a pair.

    Let’s delve into the world of position trading, where time becomes an ally, and the art of fundamental analysis reigns supreme.

    The Essence of Position Trading: Position trading, in essence, is akin to being the captain of a large, sturdy ship navigating through the vast ocean of the forex market. While day traders and scalpers focus on the short-term ripples and waves, position traders set their sights on the long-term currents. They believe that by holding their positions steadfastly over extended periods, they can ride the tide to substantial profits.

    When a trader adopts the position trading technique, they commit to maintaining their bullish or bearish stance on one of the currencies within a currency pair. This stance is based on their analysis of the market, economic indicators, central bank policies, and their outlook on the economic landscape.

    The Role of Fundamental Analysis: Fundamental analysis becomes the guiding star for position traders. Unlike shorter-term trading styles that may rely more on technical analysis, position trading leans heavily on understanding the fundamental factors that drive currency movements.

    Key components of this analysis include monitoring economic indicators such as GDP growth, employment figures, inflation rates, and trade balances. Central bank monetary policies, interest rate decisions, and their impact on currency values also fall under the purview of position traders.

    A Cautionary Note on Resources: Given the extended duration of position trades, it’s paramount for traders to ensure they have sufficient capital in their trading accounts. This financial buffer acts as a shield against short-term market fluctuations that may temporarily move against the trader’s position. Without an adequate margin of safety, traders risk being forced to liquidate their positions prematurely due to margin calls.

    Additionally, traders need to be mindful of overnight funding fees associated with holding long-term positions in the spot forex market. These fees can accrue over time and impact the overall profitability of the trade.

    Position Trading in Practice: Position traders often represent their trading activities by calculating a single average price based on their overall exposure to a currency pair. This allows them to make informed and calculated decisions throughout the duration of the trade. They may use various indicators, such as moving averages, to identify trends and potential reversal points. Support and resistance levels also play a vital role in their strategic planning.

    In essence, position trading is a patient and strategic endeavor. It’s about setting a course and then steering the ship with unwavering resolve, regardless of short-term market fluctuations. It’s an art that requires discipline, a keen understanding of market fundamentals, and a commitment to the long game.

    Position trading represents a unique and patient approach to forex trading, where traders set their sights on long-term horizons. It’s a technique that demands a deep understanding of fundamental analysis, careful resource management, and the ability to weather short-term market volatility. While it may not offer the adrenaline rush of shorter-term trading styles, position trading offers the potential for substantial profits to those who are willing to embrace the journey through time in the forex market.

    3. Ichimoku Cloud

    In the realm of advanced forex trading, where precision and insight are paramount, the Ichimoku Cloud emerges as a formidable technical indicator—a trusted ally for traders seeking to navigate the complexities of the market. This sophisticated tool amalgamates a wealth of data, including multiple averages, market trends, and momentum indicators, into a visual masterpiece that can potentially unlock profitable trading opportunities.

    Let’s take a closer look at the Ichimoku Cloud, unraveling its intricate components and unveiling its prowess as a critical technical indicator.

    The Five Pillars of Ichimoku Cloud: At the heart of the Ichimoku Cloud are five carefully calculated lines that adorn a price chart:

    1. Tenkan-sen (Conversion Line): The Tenkan-sen is akin to the navigator on a ship, charting the course. It represents a short-term moving average and reacts swiftly to price movements.
    2. Kijun-sen (Base Line): The Kijun-sen plays the role of a stabilizing force, akin to the ship’s anchor. It represents a longer-term moving average and provides a broader perspective on price trends.
    3. Senkou Span A (Leading Span A): This line serves as the vanguard of the Ichimoku Cloud, leading the way. It’s calculated by averaging the Tenkan-sen and Kijun-sen values and projecting them forward.
    4. Senkou Span B (Leading Span B): The Senkou Span B acts as a supportive pillar within the Ichimoku Cloud. It’s determined by calculating the highest high and lowest low over a specified period and projecting them forward.
    5. Chikou Span (Lagging Span): The Chikou Span is akin to the rearview mirror, reflecting on past price action. It represents the current closing price, shifted backward on the chart.
    Advanced Forex Trading
    Source:ig

    The Cloud’s Purpose: Collectively, these five lines create the iconic ‘cloud’ that defines the Ichimoku Cloud. This cloud is not a mere aesthetic feature; it’s a critical technical indicator with profound implications for traders. It serves as a dynamic canvas upon which potential price movements are painted.

    Reading the Cloud: The Ichimoku Cloud excels at predicting critical support and resistance levels. When the Leading Span A rises above Leading Span B, it signals an uptrend, akin to a green light for bullish traders. Conversely, if Leading Span A falls below Leading Span B, it’s akin to a red light, signaling a downtrend.

    However, the subtlety of the Ichimoku Cloud lies in its interpretation of transitional states. When the price resides within the cloud, it signifies a market in flux, characterized by uncertainty and potential for change. It’s like navigating uncharted waters, where traders must exercise caution and await clearer signals.

    The Power of Candlestick Analysis: Traders often enhance the Ichimoku Cloud’s efficacy by analyzing the position of candlesticks relative to the cloud. When prices soar above the cloud, it often indicates an upward trajectory, providing traders with an opportunity to ride the bullish wave. Conversely, when prices dip below the cloud, it’s a bearish sign, suggesting a potential downturn. And when prices meander within the cloud, it’s akin to a market in transition, where traders tread cautiously.

    Becoming an Ichimoku Cloud Maestro: With diligent practice and study, the Ichimoku Cloud technique transforms from a complex tool into an increasingly user-friendly and effective instrument in a trader’s toolkit. It becomes a trusted companion, guiding traders through the intricate maze of forex markets.

    The Ichimoku Cloud rises to the occasion, offering traders a multifaceted tool that combines technical prowess with visual clarity. It serves as a lighthouse in the forex sea, helping traders navigate with confidence, interpret market trends, and potentially unlock profitable opportunities. With dedication and practice, becoming an Ichimoku Cloud maestro is within reach, allowing traders to harness its power and elevate their trading endeavors to new heights.

    4. Forex Scalping

    In the world of advanced forex trading, there exists a unique and exhilarating strategy known as forex scalping. It’s a trading style characterized by its lightning-fast pace, involving the rapid opening and closing of multiple positions, with each trade lasting only a matter of seconds or minutes. Unlike long-term trading strategies that require patience and endurance, scalping is all about seizing numerous small gains within the fleeting moments of a market trend.

    Advanced Forex Trading
    FOREX SCALPING
    Source:ig

    Let’s dive into the world of forex scalping, exploring its intricacies and understanding the tools employed by scalpers to navigate the fast-paced terrain.

    The Essence of Forex Scalping: Imagine being in the heart of a bustling marketplace, where prices are in constant motion. Scalpers are akin to agile traders in this bustling marketplace, darting in and out of positions with the precision of a skilled athlete. Each trade they execute is like a lightning strike—quick, decisive, and aimed at capturing small yet numerous profits.

    The Scalper’s Arsenal: To excel in forex scalping, traders employ a sophisticated arsenal of indicators and tools. One such tool is the Bollinger Bands, which serve as sentinels, identifying areas of market volatility. Scalpers recognize that within these volatile zones lie opportunities for quick gains.

    Another essential tool is the moving average, which acts as a compass, helping scalpers identify both established and emerging market trends. This indicator guides them in their decision-making process, ensuring they align with the prevailing market direction.

    The stochastic oscillator serves as a vigilant watchdog. It compares a forex pair’s current value to its recent trading range, alerting scalpers to potential overbought or oversold conditions. This information is invaluable for timing entry and exit points.

    The Quest for Pips: In the world of scalping, traders set their sights on gaining just a few pips at a time. A pip, an abbreviation for “percentage in point,” represents the smallest price change in a forex pair, typically measured at the fourth decimal place. For example, if a quoted price for a forex pair decreases from 1.3981 to 1.3980, it has fallen by one pip.

    The goal is simple yet powerful: accumulate numerous small profits, like droplets filling a bucket. Over time, these gains accumulate into a substantial sum, all while avoiding the waiting game for larger profits that long-term traders endure.

    Riding the Waves: Scalpers have a keen eye for currency pairs that exhibit rapid price movements. They often target pairs that are either on an upward trajectory or experiencing a decline. When anticipating a price increase, scalpers open positions to ‘buy’ (going long), betting that the upward momentum will yield quick profits. Conversely, when they anticipate a decline, they initiate ‘sell’ positions (going short) to profit from the impending drop in price.

    Forex scalping is a thrilling and dynamic trading style that demands razor-sharp focus, quick decision-making, and unwavering discipline. While it may not offer the allure of substantial profits in a single trade, its power lies in the cumulative effect of numerous small gains. Forex scalpers are akin to agile predators in the forex jungle, moving swiftly and confidently to seize opportunities as they arise. It’s a strategy that embraces the fast-paced nature of the market, offering traders the chance to reap profits in the blink of an eye. For those who thrive on adrenaline and possess the acumen to read market nuances, forex scalping is a strategy that can be both exhilarating and rewarding.

    5. Nonfarm Payrolls (NFP) Trading

    In the realm of advanced forex trading, where precision and insight are paramount, one economic indicator rises to prominence—the Nonfarm Payrolls (NFP) report. This report stands as a beacon, eagerly awaited by traders around the globe, providing critical insights into the health of the American economy.

    Let’s embark on a journey into the world of NFP trading, unraveling its significance, and understanding how it influences the forex market.

    The NFP Report Unveiled: The Nonfarm Payrolls report serves as a monthly revelation of the number of jobs created in the United States within the non-agricultural sector during the previous month. It’s a treasure trove of data that shines a spotlight on the nation’s employment landscape, shedding light on key economic trends.

    Why NFP Matters: You may wonder why a report from a single country holds such sway in the global forex market. The answer lies in its profound implications. The NFP report is not merely a collection of statistics; it’s a window into the activity and vitality of the American economy—a powerhouse that exerts a gravitational pull on the global financial stage.

    Here’s the crux of the matter: When demand for the US dollar (USD) surges, the currency appreciates in value. Conversely, when demand wanes, the USD weakens. The NFP report is a key driver of this demand dynamics.

    The Dance of Forex Traders: Picture a bustling forex trading floor, where traders, analysts, and investors are on high alert, eagerly awaiting the release of the NFP report. When the numbers are unveiled, it’s akin to opening Pandora’s box—a surge of activity ensues.

    Forex traders, armed with the insights from the NFP report, have the opportunity to capitalize on the market’s reaction to this critical data. They leverage their positions, making calculated moves based on the report’s implications for the USD and other global currencies.

    Strategic Leverage: The NFP report is not merely a data point; it’s a strategic lever that forex traders can use to their advantage. Depending on the report’s findings, traders may choose to go long on the USD if the employment data is robust, indicating a healthy American economy. Conversely, they may opt to go short on the USD if the data reveals weaknesses.

    The forex market’s reaction to the NFP report is swift and profound. Prices fluctuate, trends emerge, and opportunities materialize within moments of its release. Traders who can read the data and anticipate the market’s response stand to profit from these rapid movements.

    In the world of advanced forex trading, being attuned to critical economic indicators is essential. The NFP report, with its profound influence on the forex market, serves as a pivotal tool for traders seeking to navigate the complexities of currency trading. It’s a monthly spectacle where economic data meets financial strategy, and traders seize the moment to make calculated moves. For those who possess the insight and agility to interpret the NFP report’s implications, it becomes a powerful lever to harness the market’s movements and make informed trading decisions.

    How to Start Trading Using Advanced Forex Techniques

    Having ventured into the realm of advanced forex trading, you’re now standing at the threshold of a journey that promises confident mastery of the forex market. To set you on the right course, let’s outline a step-by-step guide to launch your trading endeavors with precision and purpose.

    1. Open an Account
      The first and foremost step is to choose a reputable forex trading platform and initiate the process of opening an account. You have two primary options: a live trading account, where you engage with real funds and real risks, or a demo account, which offers a risk-free environment for practice and learning. The latter is an excellent choice for beginners or those looking to test new strategies.
    2. Select a Currency Pair
      With your trading account established, the next decision revolves around currency pairs. Consider your analysis, market expectations, and trading goals as you choose the currency pair(s) you wish to trade. The choice may be influenced by economic factors, geopolitical events, or technical indicators.
    3. Determine ‘Buy’ or ‘Sell’
      The heart of forex trading lies in your ability to assess market conditions and make informed decisions. Depending on your analysis, you will decide whether to ‘buy’ (go long) or ‘sell’ (go short) on your chosen currency pair. This decision hinges on your anticipation of price movements, whether it’s upward (buy) or downward (sell).
    4. Set Stops and Limits
      Risk management is paramount in advanced forex trading. Before entering a trade, establish stop-loss and take-profit orders. The stop-loss acts as a safety net, automatically closing your position if the market moves against you beyond a certain point. The take-profit order secures your potential profits by closing the trade when a predefined profit level is reached. These orders help you manage risk and protect your capital.
    5. Open Your First Trade
      With your analysis, strategy, and risk management parameters in place, it’s time to execute your first trade. This action sets your journey in motion, and the market’s response to your trade will determine its initial outcome.
    6. Monitor and Close Your Position
      Once your trade is live, your role shifts to monitoring its performance. Keep a vigilant eye on market developments, price movements, and any relevant news that may impact your trade. Staying informed is key to making timely decisions. Adhere to your predefined exit strategy, whether it’s triggered by reaching your profit target (take-profit) or by risk management measures (stop-loss).

    Continuous Learning and Adaptation
    Advanced forex trading is a dynamic and ever-evolving field. As you progress on your journey, remember that learning and adaptation are your constant companions. Stay informed about market trends, explore new strategies, and be open to refining your skills. The forex market offers abundant opportunities, and your journey towards confident mastery is a process of growth and discovery.

    Spot Forex

    As you delve deeper into the world of advanced forex trading, you’ll encounter a powerful tool that can both amplify your potential gains and intensify your risks—leverage. Spot forex trading with leverage opens up a realm of possibilities, but it comes with a heightened need for strategic risk management.

    Let’s explore the dynamics of spot forex trading and leverage, understanding how they can reshape your trading experience.

    Spot Forex Unveiled: At its core, spot forex trading involves the purchase or sale of currency pairs at their current market price. Unlike futures or options contracts, spot forex allows for the immediate exchange of one currency for another. It’s the foundation of forex trading, where transactions occur “on the spot.”

    The Leveraging Power: What sets advanced forex trading apart is the strategic use of leverage. Leverage enables you to control a larger position in the market than your initial capital investment. In essence, it’s like borrowing funds from your broker to engage in larger trades.

    For instance, if you have $1,000 in your trading account and employ 50:1 leverage, you can potentially control a position worth $50,000. This amplification of your trading power is both an advantage and a double-edged sword.

    Leverage: A Double-Edged Sword: Leverage has the remarkable ability to magnify your profits when the market moves in your favor. A small price movement can yield substantial gains due to the larger position size you control. However, it’s equally important to recognize that leverage can amplify your losses if the market moves against you.

    Imagine using 50:1 leverage, as in the previous example. While your potential gains are multiplied, so are your potential losses. Even a modest price movement against your position can result in significant losses relative to your initial investment.

    The Imperative of Risk Management: With great power comes great responsibility. Effective risk management is not a choice but a necessity in the world of advanced forex trading with leverage. Here are key risk management principles to consider:

    1. Position Sizing: Determine the appropriate size of your positions based on your risk tolerance and the volatility of the currency pair you’re trading.
    2. Stop-Loss Orders: Always set stop-loss orders to limit potential losses. These orders automatically close your position if the market moves against you beyond a specified point.
    3. Take-Profit Orders: Similarly, employ take-profit orders to secure your desired profits. These orders close your position when a predetermined profit level is reached.
    4. Margin Requirements: Be aware of margin requirements imposed by your broker. Falling below the required margin level may result in forced liquidation of your positions.
    5. Diversification: Avoid over-concentration in a single currency pair or trading strategy. Diversifying your portfolio can help spread risk.

    Conclusion

    In summary, advanced forex trading involves implementing a variety of strategies and techniques to navigate the forex market successfully. Whether you’re hedging to mitigate risk, practicing position trading for the long term, utilizing the Ichimoku Cloud for technical analysis, scalping for short-term gains, or capitalizing on NFP reports, these methods can help you optimize your trading portfolio.

    However, it’s essential to recognize that while these advanced techniques offer opportunities for profit, they also carry inherent risks. Prioritize risk management, and ensure you are well-prepared and suited to handle the challenges of advanced forex trading.

    With the right knowledge, practice, and discipline, you can confidently master advanced forex trading and transform your portfolio into a more profitable and resilient entity.

    Click here to read our latest article on Art of Profitable Gap Trading

    FAQs

    1. What is advanced forex trading? Advanced forex trading involves the use of sophisticated strategies and techniques to navigate the foreign exchange market for profit, beyond basic trading practices.
    2. Why are currency pairs important in forex trading? Currency pairs are fundamental in forex trading as they represent the relationship between two currencies, with one being the base and the other the quote. Understanding these pairs is crucial for advanced trading.
    3. How does hedging work in forex trading? Hedging in forex involves mitigating risk by taking offsetting positions in related currency pairs. It’s a protective strategy to minimize potential losses.
    4. What is position trading, and how does it differ from other strategies? Position trading is a long-term strategy where traders ‘buy and hold’ positions for extended periods. It relies heavily on fundamental analysis and differs from short-term strategies like scalping.
    5. What is the Ichimoku Cloud indicator used for in forex trading? The Ichimoku Cloud is a technical indicator that combines multiple averages and trends. It helps traders predict support or resistance levels and identify market transitions.
    6. What is forex scalping, and why do traders use it? Forex scalping is a fast-paced trading style where traders aim to capture small gains within a trend’s duration. Traders use it to accumulate multiple small profits.
    7. What is the significance of the Nonfarm Payrolls (NFP) report in forex trading? The NFP report reflects the health of the U.S. economy and influences the demand for the U.S. dollar, making it a critical factor in forex trading.
    8. How can I start trading using advanced forex techniques? To start, open an account with a reputable forex trading platform, select currency pairs, decide on ‘buy’ or ‘sell’ positions, set risk management orders, execute your first trade, and closely monitor your position.
    9. What is leverage in forex trading, and how does it work? Leverage allows traders to control larger positions than their initial capital. While it amplifies potential gains, it also increases the risk of larger losses if the market moves against you.
    10. Why is risk management crucial when trading with leverage in spot forex? Risk management is imperative because leverage can magnify both profits and losses. Proper risk management, including stop-loss and take-profit orders, helps safeguard your capital.

    Click here to learn more about Advanced Forex Trading Concepts

  • Master the Art of Profitable Gap Trading: Unleash Success with Expert Strategies

    Master the Art of Profitable Gap Trading: Unleash Success with Expert Strategies

    Gap trading, a strategy rooted in the art of analyzing price discrepancies between trading sessions, is a fascinating realm of the financial markets. This article delves deep into the world of gap trading, offering insights into the core concepts, expert strategies, and the secrets behind mastering this unique approach. Whether you’re a seasoned trader looking to refine your gap trading skills or a newcomer eager to unlock the potential of these market anomalies, read on to explore the art of profitable gap trading.

    Introduction

    Gap Trading two words that carry the promise of profit, intrigue, and opportunity. In the ever-evolving landscape of financial markets, gap trading stands as a distinct and intriguing strategy. It hinges on the observation that price disparities often emerge between trading sessions, creating gaps in price charts. These gaps present traders with windows of opportunity, and mastering the art of gap trading can lead to substantial rewards.

    What is a Gap?

    In the world of gap trading, understanding the concept of a gap is fundamental. A gap is not just a simple void or empty space on a price chart; it represents a significant and intriguing phenomenon within the financial markets.

    To put it plainly, a gap occurs when there is a notable disparity between the closing price of one trading session and the opening price of the next. When this happens, it creates a visible gap on the price chart, where no trading activity has taken place in between these two price points. The market essentially jumps from one level to another, leaving a gap that traders keenly observe.

    The intriguing question that arises is, Why do these gaps appear in the first place? Gaps are the result of various underlying factors, primarily rooted in fundamental aspects that can exert a powerful influence on market dynamics. Let’s delve into some of the common scenarios that lead to the emergence of gaps:

    1. Earnings Reports and Corporate News: One of the most common catalysts for gaps is the release of a company’s earnings report. Picture this: a publicly traded company announces its earnings after the regular trading hours, and the report reveals exceptional financial results or positive developments within the company. Investors and traders react with enthusiasm and confidence in the company’s prospects. As a result, when the market reopens, the stock’s price may surge significantly higher than its previous closing price. This abrupt price jump creates a gap on the price chart, symbolizing the overnight shift in market sentiment.
    2. Product Announcements: Gaps can also be triggered by product-related news or announcements. Imagine a tech company unveiling a groundbreaking product with the potential to revolutionize an industry. Anticipation and excitement build around this announcement, and traders and investors rush to position themselves in the market. When the market opens on the next trading day, the stock’s price might open at a level substantially different from its prior close, forming a gap.
    3. Analyst Actions: Analyst upgrades and downgrades can wield substantial influence over market behavior. If a highly respected analyst releases a report recommending a particular stock, it can spark a surge in demand, causing the stock’s price to gap higher at the opening of the next session. Conversely, a negative analyst report can lead to a gap down in the stock’s price as investors react to the downgrade.
    4. Key Appointments and Leadership Changes: Leadership changes within a company can also trigger gaps. For instance, if a renowned industry expert is appointed as the CEO of a struggling company, investors may perceive this as a positive development that could turn the company’s fortunes around. Consequently, the stock’s price may gap up as traders react to this change in leadership.
    Gap Trading
    A GAP IN TRADING
    Source: DFX

    Understanding the various factors that can lead to gap formation is crucial for gap traders. These gaps provide valuable insights into market sentiment and can serve as opportunities for traders to capitalize on significant price movements. In the world of gap trading, these gaps are not mere voids on a chart; they are windows of opportunity that hold the potential for profitable trades.

    The Four Types of Gaps in Trading

    Now that we have established the fundamental concept of gaps in trading and why they manifest, it’s time to embark on a journey into the captivating world of gap trading by delving deeper into the four primary types of gaps that traders encounter:

    Common Gaps

    • Characteristics: Common gaps are the simplest and most straightforward among the gap types. They manifest independently of intricate price patterns, often appearing as a sudden jump in price with little accompanying fanfare.
    • Trading Opportunities: Unfortunately, common gaps do not typically offer particularly enticing trading opportunities. Traders often find that common gaps lack the distinct indicators or signals that accompany other gap types. As a result, they are less frequently targeted for trading strategies.

    Breakaway Gaps

    • Characteristics: Breakaway gaps mark the initiation of a new trend in the price action of an asset. These gaps are notable for the fact that the asset “gaps away” from its previous price pattern. It’s like the asset suddenly decides to venture into new territory, breaking free from its prior confines.
    • Trading Opportunities: Breakaway gaps are highly significant for traders. When a breakaway gap occurs in conjunction with higher trading volume, it serves as a potent signal for traders to take action. For example, a breakaway gap to the upside, accompanied by robust trading volume, may encourage traders to consider establishing a long position. Conversely, a breakaway gap to the downside, also supported by significant volume, may trigger a short position.
    Gap Trading
    BREAKAWAY GAPS
    Source: DFX

    Continuation or Runaway Gaps

    • Characteristics: Continuation or runaway gaps signify an acceleration of an already established bullish or bearish trend. These gaps are often the result of a significant news event that reinforces market sentiment and propels the trend further in its current direction.
    • Trading Opportunities: Traders who identify a continuation gap may choose to follow the existing trend, believing that the news event has provided renewed strength to the prevailing market sentiment. For a bullish runaway gap, traders may set a stop just below the gap to manage risk, while for a bearish runaway gap, a stop just above the gap can be a prudent risk management strategy.
    Gap Trading
    CONTINUATION OR RUNAWAY GAPS
    Source: DFX

    Exhaustion Gaps

    • Characteristics: Exhaustion gaps stand in stark contrast to continuation gaps. They represent a final gap in the direction of the prevailing trend, followed by an imminent reversal. These gaps are often ignited by a collective “herd mentality” among traders who rush to join the trend, ultimately pushing the asset’s price into overbought or oversold territory.
    • Trading Opportunities: Experienced traders keep a vigilant eye on exhaustion gaps because they signal the exhaustion of the prevailing trend’s strength. Anticipating the impending reversal, traders position themselves in the opposite direction to the prior trend. For example, if an exhaustion gap occurs after a prolonged uptrend, traders may consider taking a short position, expecting a bearish reversal.
    Gap Trading
    EXHAUSTION GAPS
    Source:DFX

    Understanding these four fundamental types of gaps and being able to recognize them is pivotal for gap traders. Armed with this knowledge, traders can navigate the complexities of gap trading with greater confidence and precision. Each gap type tells a unique story of market sentiment and provides opportunities for informed and strategic trading decisions. Gap trading becomes an art form, where traders decipher the language of price gaps to unlock potential profits in the financial markets.

    What Does It Mean When a Gap Has Been ‘Filled’?

    In the realm of gap trading, the term “filled gap” carries substantial weight and plays a pivotal role in traders’ decision-making processes. So, what exactly does it mean when we talk about a gap being “filled,” and why is this concept crucial in the world of gap trading?

    Gap Filling Defined

    When we refer to a gap being “filled,” we are essentially describing a scenario where the price of an asset retraces to its original level before the gap occurred. This retracement typically unfolds over the subsequent days or weeks, effectively bridging the gap that was created between two trading sessions. In essence, the market corrects itself by revisiting the price level from the day just before the gap event.

    Several factors and dynamics come into play when we discuss gap fill stocks and the process of gap filling:

    1. Price Corrections: The phenomenon of a gap being filled is often driven by the need for price corrections. When a significant price gap occurs, it can be a result of an overly optimistic or pessimistic market sentiment in response to the catalyst that triggered the gap. However, as traders and investors reassess the situation and incorporate new information, the initial sentiment may no longer be justified. Consequently, price corrections are initiated as market participants adjust their positions to align with the evolving fundamentals and sentiment.
    2. Support and Resistance Levels: Even in the midst of dramatic price movements associated with gaps, the fundamental principles of support and resistance continue to exert their influence. Key support and resistance levels remain relevant, guiding the price retracement process as the market strives to fill the gap. These levels act as significant barriers and reference points for traders, influencing their decisions on when and where to enter or exit positions.
    3. Gap Types and Patterns: The likelihood of a gap being filled is also influenced by the nature of the gap itself. Different gap types have varying tendencies when it comes to retracement and filling. For instance, gap reversals are more commonly observed with exhaustion gaps. This type of gap signals the end of a prevailing price trend and often results in a retracement that fills the gap. Traders who specialize in gap trading pay close attention to these patterns and gap types to gauge the probability of a gap being filled.

    In summary, the concept of a “filled gap” in gap trading signifies the restoration of price equilibrium. It reflects the market’s inclination to rectify abrupt price disparities and return to a state of relative balance. Gap traders meticulously analyze the dynamics surrounding gap filling, taking into account factors like price corrections, support and resistance levels, and gap types, as they seek to capitalize on these retracement opportunities. Understanding gap filling is a valuable tool in a gap trader’s arsenal, allowing them to make informed decisions and seize potential profit-generating opportunities in the financial markets.

    Gap Trading Strategies & Tips

    Gap trading is an intricate art, and at its core lies a multitude of strategies and tactics that savvy traders employ to seize profitable opportunities. In this exploration, we’ll uncover some of the most effective gap trading strategies and provide you with essential tips to navigate the world of gap trading.

    Fading the Gap

    • Strategy Overview: Fading the gap is a tactical approach where traders aim to fill the gap within the same trading day it occurs. Imagine a scenario where a stock experiences a gap up at the market open, triggered by positive earnings news. As the trading day progresses, traders start delving deeper into the company’s financial reports and presentation materials. In some cases, they may uncover aspects that cast doubt or concern, prompting selling pressure to build. This selling pressure eventually causes the stock’s price to retreat, returning to the previous day’s closing level, effectively filling the gap.
    • Advantages: Fading the gap can be a highly advantageous strategy, especially when driven by the irrational exuberance of less experienced traders. This phenomenon, often fueled by the fear of missing out (FOMO), creates the initial gap. Seasoned market practitioners recognize the potential to capitalize on these scenarios, leveraging the volume that initially caused the gap to their advantage.

    Predicting a Gap

    • Strategy Overview: Predicting a gap involves the use of technical or fundamental factors to anticipate the occurrence of a gap on the next trading day. For instance, a trader well-versed in a specific company’s operations and industry trends might predict a gap for that stock ahead of an earnings report. By meticulously analyzing the company’s financials, growth prospects, and industry dynamics, traders can make informed predictions about potential gaps.
    • Advantages: Predicting a gap allows traders to proactively position themselves to capitalize on price movements driven by significant events. Armed with insightful research and analysis, traders can anticipate gaps and prepare strategies accordingly, potentially leading to substantial profits.

    Using Indicators

    • Strategy Overview: Technical indicators play a pivotal role in gap trading. Traders harness the power of tools such as the Exponential Moving Average (EMA) and the Relative Strength Index (RSI) to identify critical price levels and inform their trading decisions.
    • Advantages: Technical indicators provide traders with valuable insights into market conditions. For instance, the RSI is a potent tool for identifying overbought or oversold conditions. When used in conjunction with gap patterns, it becomes a valuable ally in pinpointing potential entry and exit points. Suppose an exhaustion gap has formed, and the RSI indicates that the market is in an overbought state. In that case, it may serve as a signal for traders to enter a short position, anticipating a forthcoming price reversal.
    Gap Trading
    USING INDICATORS
    Source: DFX

    Gap Trading Tips

    • Risk Management: Implement sound risk management practices, including setting stop-loss orders, to protect your capital in gap trading. The volatile nature of gaps demands disciplined risk management.
    • Stay Informed: Keep a vigilant eye on market news and events that can impact gaps. Being aware of changing market conditions and potential catalysts will help you adapt your strategies as needed.
    • Continuous Learning: Gap trading is a dynamic field. Stay committed to continuous learning, honing your skills, and adapting to evolving market conditions.

    In the world of gap trading, success stems from a blend of strategic prowess, risk management, and market awareness. By mastering these gap trading strategies and heeding essential tips, you’ll be well on your way to unlocking the potential for profitable gap trading endeavors.

    Gap Trading
    GAP TRADING
    Source: DFX

    Gap Trading Rules: Key Things to Consider

    As you embark on your journey into the captivating world of gap trading, it’s imperative to adhere to a set of rules and guidelines to ensure your success and safeguard your capital. Let’s explore these key considerations, which are essential for effective gap trading:

    Classify the Gap

    Understanding Gap Types: Before you take any decisive action, it’s crucial to ascertain the type of gap you’re dealing with. Is it a continuation gap, an exhaustion gap, or one of the other varieties? Each type carries distinct implications for your trading strategy. By accurately classifying the gap, you can tailor your approach to align with its characteristics and potential outcomes.

    Support and Resistance

    The Persistence of Gap Filling: Recognize that once a gap-filling process begins, it often continues until it reaches completion. This continuity is a notable feature of gap trading. Typically, there are no immediate support or resistance levels to impede the gap-filling process. As a result, traders should be prepared for the possibility of further retracement until the gap is filled.

    Amateur vs. Professional Influence

    Distinguishing Investor Influence: When evaluating a gap, consider whether it is primarily fueled by amateur or professional investors. Understanding this distinction is pivotal, as it can provide insights into the gap’s nature and potential outcomes. Amateur investors may exhibit irrational exuberance, leading to exhaustion gaps, where prices become overextended. In such cases, it is prudent to wait for price confirmation before entering a trading position. Recognizing the influence behind the gap can help you make informed decisions.

    Volume Matters

    The Significance of Trading Volume: Volume is a critical factor in gap trading. It serves as a valuable indicator of market sentiment and conviction. Breakaway gaps, which signal strong shifts in market sentiment, often coincide with high trading volume. These gaps are characterized by robust market conviction and are typically accompanied by substantial trading activity. Conversely, exhaustion gaps frequently occur with lower trading volume, reflecting a lack of sustained market enthusiasm. Traders should be attuned to volume trends, as they can provide valuable insights into the strength of a gap and its potential continuation or reversal.

    Caution and Risk Management

    Navigating Volatility with Caution: Gap trading entails navigating the volatile waters of the stock market, often in conditions of low liquidity. Due to the inherent unpredictability of gaps, traders must exercise caution at all times. One of the fundamental tenets of successful gap trading is effective risk management. Implementing sound risk management practices, including the use of stop-loss orders, is paramount to protect your capital and mitigate potential losses.

    In summary, gap trading offers unique opportunities for traders to profit from price disparities resulting from market events. By adhering to these essential gap trading rules and considerations, you can enhance your ability to make informed decisions, manage risk effectively, and unlock the potential for success in the dynamic and captivating world of gap trading.

    Conclusion

    In the world of financial markets, gap trading stands as a distinct and captivating strategy. Understanding the nuances of gap trading, recognizing the four types of gaps, and mastering trading strategies such as fading the gap can empower traders to unleash their full potential.

    As you explore the art of profitable gap trading, remember that success in this arena requires a combination of knowledge, discipline, and a keen understanding of market psychology. Whether you’re looking to capitalize on breakaway gaps, predict gap movements, or apply technical indicators, the key lies in your commitment to learning and adapting your approach.

    So, embark on your gap trading journey with confidence, equip yourself with expert strategies, and unlock the doors to profitable trading through the art of mastering the gaps.

    Click here to read our latest article on Trend Trading: Understanding the Pros, Cons & Dangers

    FAQs

    1. What is Gap Trading? Gap trading is a trading strategy that involves capitalizing on price discrepancies or gaps that occur between trading sessions.
    2. What are the main types of gaps in gap trading? Gap trading recognizes four primary gap types: common gaps, breakaway gaps, continuation or runaway gaps, and exhaustion gaps.
    3. Can you explain the concept of common gaps in gap trading? Common gaps are straightforward gaps in price action that usually don’t offer significant trading opportunities and are independent of price patterns.
    4. What are breakaway gaps, and how do traders approach them? Breakaway gaps signal the beginning of a new trend. Traders may consider going long for a breakaway gap up and short for a breakaway gap down, especially when accompanied by higher trading volume.
    5. How do continuation or runaway gaps affect gap trading? Continuation or runaway gaps indicate an acceleration of an existing trend. Traders often follow the trend and set stop-loss levels to manage risk.
    6. What distinguishes exhaustion gaps in gap trading, and how should traders respond to them? Exhaustion gaps represent a final gap in the trend’s direction before a reversal. Experienced traders anticipate the reversal and take a position contrary to the prior trend.
    7. What does it mean when a gap has been ‘filled’ in gap trading? A gap being ‘filled’ refers to the price retracing to its original level before the gap occurred, typically over the following days or weeks.
    8. What strategies are commonly used in gap trading? Gap trading strategies include “fading the gap,” “predicting a gap,” and using technical indicators such as the Exponential Moving Average (EMA) and RSI.
    9. What role do technical indicators play in gap trading? Technical indicators like the RSI can help traders identify entry and exit points in gap trading by signaling overbought or oversold conditions.
    10. What are key considerations for successful gap trading? Successful gap trading involves classifying gap types, recognizing support and resistance levels, assessing the influence of amateur vs. professional investors, monitoring trading volume, and practicing cautious risk management.

    Click here to learn more about Gap Trading

  • Trend Trading: Understanding the Pros, Cons & Dangers

    Trend Trading: Understanding the Pros, Cons & Dangers

    In the fast-paced world of financial markets, traders employ a wide array of strategies to navigate the ever-changing terrain of investments. One of the most popular and sought-after approaches is “Trend Trading.” In this comprehensive article, we will delve deep into the world of trend trading, exploring its advantages, disadvantages, and potential pitfalls. Whether you’re a seasoned trader looking to refine your strategy or a novice seeking to understand the intricacies of trend trading, this guide will provide valuable insights.

    The Pros of Trend Trading

    Trend Trading and Its High Risk/Reward Ratios

    At the core of trend trading, a captivating and compelling aspect that beckons traders is the promise of high risk/reward ratios. This trading approach thrives on the fundamental principle that robust trends have the potential to persist far longer than our initial expectations. It’s almost akin to discovering a hidden treasure chest within the market’s dynamics.

    The fundamental advantage of trend trading revolves around the potential for substantial rewards in relation to the risks undertaken. Unlike other trading strategies like mean reversion or range trading, which often come with constraints tied to market conditions, trends exhibit a natural expansiveness. This inherent nature of trends allows traders to unlock higher risk/reward ratios, making trend trading an irresistibly alluring prospect for traders seeking to maximize their returns.

    To truly grasp the power of these high risk/reward ratios, let’s immerse ourselves in a hypothetical scenario. Imagine a trader who achieves a win rate of 40% on their trades. It may appear that the odds are stacked against them with a majority of their trades resulting in losses. However, the beauty of trend trading shines through when we examine the returns in detail. This trader, despite the relatively low win percentage, manages to make three times more on their winning trades than they lose on their losing trades. The mathematics behind this strategy works in their favor, leading to a net gain.

    This scenario exemplifies the essence of trend trading: even if you’re right less often than you’re wrong, the potential for outsized gains on winning trades can substantially outweigh the losses incurred. In essence, high-risk/reward ratios become the secret weapon that trend traders wield to stay ahead in the markets.

    The Pitfall of Lower Win Percentages

    Amidst the allure of high-risk/reward ratios, it’s essential to acknowledge the challenges that trend trading presents. One notable drawback is the relatively lower winning percentages associated with this strategy. The financial markets are dynamic and unpredictable, often oscillating between phases of trends and ranges. Trends, although enticing, can dissipate as swiftly as they emerge, leaving trend traders with a lower probability of winning on individual trades.

    For traders, this lower win percentage can pose a psychological challenge. As humans, we are naturally averse to the sensation of loss. The emotional turmoil that accompanies frequent losses can be daunting, leading to self-doubt and second-guessing. It requires a level of mental fortitude and discipline to accept this reality – that successful trend trading involves embracing periodic losses in exchange for the promise of exceptional gains.

    However, it’s crucial to remember that this is where the math behind trend trading works in favor of the dedicated trader. The occasional outsized wins more than compensate for the string of smaller losses. By understanding and accepting this fundamental aspect of trend trading, traders can navigate the psychological hurdles and position themselves for long-term success in the ever-evolving world of financial markets.

    Navigating the Waters of Trend Trading

    Trends Across Different Time-Frames

    One of the remarkable aspects of trend trading is its inherent adaptability across various time-frames. Whether you’re seeking the excitement of short-term trades that unfold over a few days or the steadiness of long-term investments that span several weeks, trend trading offers a wealth of opportunities to explore and exploit.

    Short-Term Trading: For traders with a penchant for quick market movements and nimble decision-making, short-term trend trading is an appealing option. Here, trends are observed on shorter time-frames, often measured in minutes or hours. The advantage lies in capturing rapid price changes and profiting from these swift market shifts. Short-term trend traders thrive on the adrenaline rush of identifying opportunities and making precise entries and exits in the blink of an eye.

    Long-Term Investments: On the other end of the spectrum, trend trading can also cater to those with a more patient outlook. Long-term trend trading involves identifying trends that unfold over weeks, months, or even years. This approach suits individuals who prefer a more laid-back approach to trading, allowing them to ride the waves of sustained trends. It’s akin to setting sail on a journey, knowing that the destination is far in the distance.

    Trend Trading
    TREND ON DAILY CHART OF S&P 500
    Source: DFX

    Synergy Across Time-Frames: What makes trend trading truly fascinating is the potential for synergy between different time-frames. Picture this scenario: an uptrend on a short-term chart aligns harmoniously with a longer-term trend moving in the same direction. This alignment can be likened to the stars aligning for a trader, offering a unique convergence of opportunities. It’s the equivalent of catching both the short-term waves and the long-term tides, maximizing the potential for profit.

    However, amidst the allure of navigating trends across different time-frames, there is a crucial caveat to consider – maintaining clarity and focus. Attempting to capture trends on an excessive number of time-frames can lead to confusion and, ultimately, inconsistent trading results.

    The Perils of Overcomplication: It’s tempting to think that trading across multiple time-frames will increase the number of opportunities and potentially boost profits. In reality, the opposite can occur. Juggling numerous time-frames can lead to information overload, causing analysis paralysis and decision-making dilemmas. The risk of contradictory signals arising from different time-frames can cloud judgment and hinder effective execution.

    Finding Your Time-Frames: To avoid the pitfalls of overcomplication, seasoned trend traders recommend selecting a few time-frames that resonate with your trading goals and expertise. This focused approach streamlines your trading strategy, allowing you to develop a deeper understanding of your chosen time-frames. By specializing in a limited set of time-frames, you can fine-tune your analysis, gain confidence in your trading decisions, and maintain consistency in your execution.

    Trend Trading
    TREND UNFOLDING ON 1 HOUR CHART OF EUR/USD
    Source: DFX

    In essence, trend trading offers a world of possibilities, with the flexibility to cater to your preferred trading horizon, be it short-term excitement or long-term stability. However, the key to success lies in choosing your time-frames wisely, avoiding the siren call of complexity, and embracing clarity and expertise in your selected domains. By mastering the art of navigating trends across your chosen time-frames, you can harness the true potential of trend trading and chart a course toward profitability in the dynamic world of financial markets.

    Practical Tips for Successful Trend Trading

    Trend trading is a dynamic and rewarding strategy, but mastering it requires a combination of skill, discipline, and a well-rounded approach. To thrive as a trend trader and navigate the market’s ebb and flow successfully, consider the following practical tips:

    Identifying and Confirming Trends

    To embark on a journey of successful trend trading, your first compass is the ability to identify and confirm trends accurately. This fundamental skill will be your guiding star as you navigate the markets. Here’s how you can hone this skill:

    Utilize Technical Indicators: Technical indicators are your trusty tools for spotting potential trends. Tools like Moving Averages, Relative Strength Index (RSI), and Bollinger Bands can provide valuable insights into market direction and momentum. Pay close attention to crossovers, divergences, and breakouts to identify trend initiation points.

    Fundamental Analysis Factors: While technical analysis is a cornerstone of trend trading, don’t neglect the impact of fundamental analysis factors. Economic indicators, geopolitical events, and corporate news can influence the direction of trends. Stay informed about these fundamental factors to gain a holistic view of market conditions.

    Combining Technical and Fundamental Analysis: The most successful trend traders often blend technical and fundamental analysis to form a comprehensive understanding of the market. By using both tools in tandem, you can confirm trends more confidently and make informed trading decisions.

    Effective Risk Management

    Risk management is the lifebelt that ensures your trading journey remains afloat, even in turbulent waters. As a trend trader, implementing effective risk management practices is non-negotiable:

    Clear Stop-Loss Levels: Set clear and well-defined stop-loss levels for each trade. These levels act as your safety nets, limiting potential losses and preventing emotional decisions. Stick to your predetermined stop-loss points, even if the trade seems promising – discipline is key.

    Diversify Your Portfolio: Don’t put all your eggs in one basket. Diversify your portfolio by trading different assets or instruments. Spreading your risk across various positions helps safeguard your capital and reduces vulnerability to individual asset fluctuations.

    Position Sizing: Determine your position size carefully. Avoid over committing to a single trade, as this can amplify losses. As a rule of thumb, risk only a small percentage of your total trading capital on each trade. This way, you can endure losing streaks without jeopardizing your overall financial stability.

    Stay Informed About Market Conditions

    Markets are not isolated entities; they are interconnected and influenced by a multitude of external factors. To navigate trends successfully, stay vigilant about market conditions:

    Market News and Events: Keep a watchful eye on market news and events that have the potential to impact trends. Economic releases, central bank decisions, geopolitical developments, and corporate earnings reports can all trigger significant market movements. Staying informed about these events allows you to adapt your strategy as needed.

    Real-Time Data: Access real-time market data and stay updated on price movements. Utilize financial news sources, trading platforms, and analytical tools to monitor the evolving market landscape. Being aware of changing trends in real-time empowers you to make timely trading decisions.

    Continuous Learning: Trend trading is a journey of continuous learning. Stay engaged with the financial markets, explore new tools and techniques, and adapt to evolving market dynamics. A commitment to lifelong learning is the hallmark of successful trend traders.

    In conclusion, successful trend trading requires a holistic approach that encompasses trend identification, effective risk management, and staying informed about market conditions. By honing your skills in these areas, you can navigate the unpredictable seas of the financial markets with confidence, resilience, and a higher likelihood of achieving profitable trends.

    Conclusion

    In the world of financial trading, trend trading stands out as a strategy with the potential for substantial rewards. Its high risk/reward ratios have drawn many traders seeking to capitalize on the longevity of trends. However, trend trading also comes with the challenge of lower winning percentages and the need for patience in the face of frequent losses.

    Trend trading can be applied across various time-frames, offering versatility to traders. Nonetheless, it’s essential to focus on specific time-frames to avoid confusion and inconsistency in execution.

    To excel as a trend trader, it’s crucial to identify and confirm trends effectively, implement sound risk management practices, and stay informed about market conditions. By understanding the pros, cons, and potential dangers of trend trading, traders can navigate this strategy with confidence and maximize their chances of success in the dynamic world of financial markets.

    In summary, trend trading is a powerful tool in the trader’s arsenal, but it requires discipline, adaptability, and a deep understanding of market dynamics to harness its full potential.

    Click here to read our latest article on Gold Trading Strategies for Market Success

    FAQs

    1. What is trend trading? Trend trading is a strategy that involves capitalizing on the persistence of strong market trends. Traders aim to profit from the direction in which an asset’s price is moving.
    2. Why is trend trading appealing? Trend trading offers high risk/reward ratios, making it attractive to traders. It allows for substantial rewards relative to the risks involved.
    3. What is the pitfall of trend trading? The lower win percentage in trend trading can be a challenge for some traders. Markets often oscillate between trends and ranges, leading to frequent losses.
    4. How can I overcome the psychological hurdles of frequent losses in trend trading? Understanding the math behind trend trading and the potential for outsized wins on winners can help traders embrace the occasional losses.
    5. Can trend trading be applied to different time-frames? Yes, trend trading is flexible and can be applied to various time-frames, including short-term and long-term trading.
    6. What is the danger of trading on too many time-frames simultaneously? Trading on too many time-frames can lead to confusion and inconsistent trading. It’s advisable to focus on a few time-frames that align with your goals.
    7. How can I identify and confirm trends in trend trading? Traders can use technical indicators and tools, along with fundamental analysis, to identify and confirm trends. Combining both approaches enhances understanding.
    8. Why is risk management crucial in trend trading? Effective risk management, including setting clear stop-loss levels and diversifying your portfolio, safeguards your capital and helps you endure losing streaks.
    9. What external factors should I stay informed about in trend trading? Stay updated on market news, economic releases, geopolitical events, and corporate developments, as these can impact trends significantly.
    10. Is trend trading a continuous learning process? Yes, trend trading involves continuous learning and adaptation to evolving market dynamics. Staying engaged with the markets is essential for success.

    Click here to learn more about Trend Trading

  • Optimizing Returns: Gold Trading Strategies for Market Success

    Optimizing Returns: Gold Trading Strategies for Market Success

    Gold trading has been an enduring fascination for investors seeking both stability and profitability in their portfolios. In this comprehensive guide, we delve into effective Gold Trading Strategies to help you navigate the market with confidence and maximize returns. Whether you’re a seasoned trader or a newcomer to the world of precious metals, understanding the cyclical nature of gold prices and the correlation with the US Dollar is crucial. Let’s explore how to adapt to Gold market conditions and unlock the full potential of your trading endeavors.

    Gold Trading Strategies play a pivotal role in the financial success of investors, providing a unique avenue for diversification and wealth preservation. As we embark on this exploration of optimized returns, it’s essential to grasp the significance of strategic decision-making in Gold trading. The cyclical nature of gold prices and its correlation with the US Dollar form the foundation of our journey, guiding us through market conditions and tailored strategies for success.

    Basics of Gold Trading

    Before immersing ourselves in the nuanced world of Gold Trading Strategies, it’s essential to reacquaint ourselves with the fundamental aspects of gold trading. Gold’s appeal transcends time, solidifying its position as not just a commodity but a historical store of value. This enduring allure makes gold a beacon in the vast sea of trading options available to modern traders.

    The historical significance of gold as a store of value dates back centuries, attracting traders and investors alike. Unlike many other assets, gold’s intrinsic value has stood the test of time, weathering economic uncertainties and geopolitical upheavals. This stability is a cornerstone of its appeal, especially in times of market volatility.

    In today’s dynamic financial landscape, traders are presented with an array of choices across different currencies, asset classes, and geographies. Gold, however, remains a constant amidst this diversity. Its universal acceptance and recognition make it a focal point for speculators worldwide. Whether in times of economic prosperity or crisis, gold retains its luster as a safe haven, drawing both seasoned investors and newcomers seeking stability and potential returns.

    The versatility of gold trading is evident in its ability to transcend geographical boundaries. While traders can explore various markets and assets, gold’s global recognition ensures its relevance in diverse trading scenarios. This international appeal adds another layer of complexity and opportunity for those engaged in gold trading.

    In summary, understanding the basics of gold trading involves recognizing its historical appeal, its role as a store of value, and its unique position in the global trading landscape. As we delve deeper into Gold Trading Strategies, this foundational knowledge will serve as a compass, guiding traders through the intricacies of this time-tested and captivating market.

    Understanding Gold Market Conditions

    Delving into the realm of gold trading necessitates a keen awareness of its intricate market conditions. Gold, with its cycle sensitivity, unveils a dynamic landscape that traders must navigate with precision, especially when considering longer-term trends. Over the past 45 years, a careful analysis of Gold prices has unearthed distinct patterns of trends and ranges, shaping the ebb and flow of this precious metal’s value.

    Gold’s cycle sensitivity is not a mere fluctuation; it is a critical factor that acts as a guiding force for traders. This sensitivity becomes more pronounced when examining the historical trajectory of Gold prices. Through the lens of time, patterns emerge, revealing the cyclical nature that defines Gold’s behavior in the market.

    The cornerstone of successful gold trading lies in the ability to adapt to the present condition. This brings us to the first Gold Trading Tip: recognizing and adjusting to the prevailing market condition. Gold, like any other financial instrument, experiences phases of trends and ranges. These phases are not static; they evolve based on various economic, geopolitical, and global factors.

    Gold Trading Strategies

    Traders must be vigilant in discerning whether Gold is in a trend or a range-bound phase at any given time. Failing to adapt to the present market condition can lead to unfavorable results. For instance, if Gold is in a trend and a trader employs a strategy suitable for range-bound markets, the outcome may not align with expectations. Conversely, applying a trend-following strategy during a range-bound phase can also result in suboptimal outcomes.

    The adaptability to market conditions is a skill that distinguishes successful gold traders. It involves an ongoing assessment of the prevailing trends and ranges, allowing traders to tailor their strategies accordingly. This dynamic approach ensures that traders are not merely reacting to historical market conditions but are actively shaping their actions based on the evolving nature of Gold’s price movements.

    In conclusion, understanding Gold market conditions is a multifaceted endeavor that demands continuous vigilance and adaptability. Traders who grasp the cyclical nature of Gold’s price movements and align their strategies with the present condition are better positioned to navigate the complexities of the market successfully. As we explore Gold Trading Strategies, this foundational knowledge serves as a compass, guiding traders through the ever-changing currents of the gold trading landscape.

    The US Dollar and Gold Correlation

    In the intricate dance of global markets, the US Dollar emerges as a dominant force, exerting its influence across various financial landscapes. Within the realm of Gold trading, this influence takes center stage, establishing a pivotal correlation that seasoned traders must navigate with precision. The interplay between the US Dollar and Gold unveils a narrative of interconnected dynamics that significantly impact trading outcomes.

    The symbolic representation of Gold as ‘AU’ aligns with its relationship with the US Dollar, encapsulated in the widely recognized ‘XAU/USD’ quote. This combination underscores the intimate connection between the value of Gold and the strength of the US currency. Understanding this symbiotic relationship is fundamental for traders seeking to decipher the intricate web of factors influencing Gold prices.

    The dynamics of the Gold and US Dollar correlation are multifaceted. When expressed in the ‘XAU/USD’ quote, it signifies the value of one troy ounce of Gold in terms of US Dollars. This direct pricing mechanism emphasizes the role of the US Dollar as a benchmark against which the value of Gold is measured. As the US Dollar strengthens or weakens, it directly impacts the price dynamics of Gold.

    Gold Trading Strategies

    One of the critical Gold Trading Tips revolves around closely monitoring the movements of the US Dollar. Traders must be attuned to the subtle shifts and fluctuations in the value of the US currency, as these movements can serve as leading indicators for potential changes in Gold prices. This vigilance allows traders to anticipate and adapt to market conditions effectively.

    Crucially, understanding the inverse correlation between Gold and the US Dollar is a cornerstone of informed trading decisions. In simpler terms, when the US Dollar strengthens, Gold prices may experience a decline, and vice versa. This inverse relationship stems from the fact that as the US Dollar gains strength, the relative value of Gold, expressed in US Dollars, tends to decrease.

    As we delve into Gold Trading Strategies, recognizing the intricate dance between Gold and the US Dollar becomes imperative. Traders armed with this knowledge can strategically position themselves, leveraging the ebb and flow of these influential market forces. Whether it’s anticipating potential price movements or adjusting trading strategies in response to changes in the US Dollar, this understanding provides a valuable edge in the dynamic world of Gold trading.

    Time Frames in Gold Trading

    Navigating the complexities of Gold trading demands a strategic consideration of time frames—a crucial element often underestimated by novice and seasoned traders alike. As we explore the intricate dance of market conditions, understanding the significance of time frames becomes paramount. In the world of Gold Trading Strategies, the ability to analyze various time frames equips traders with a nuanced perspective, allowing for effective strategy implementation and adept adaptation to evolving market dynamics.

    Gold, with its cyclical nature, reveals different facets when observed through varying time frames. The monthly variety, while providing a broader and more encompassing view, may not capture the nuances of shorter-term trends and fluctuations. Traders, therefore, find themselves delving into shorter time frames to fine-tune their analysis and make informed trading decisions.

    The utilization of different time frames is not a mere technicality; it’s a strategic necessity. Gold Trading Tip #3 underscores this, emphasizing the crucial nature of knowing your time frames. Traders are urged to adopt a consistent and thoughtful framework for analysis, aligning it with their chosen strategies. This alignment ensures a comprehensive understanding of market conditions, allowing for well-informed and timely decision-making.

    The monthly time frame serves as a powerful tool for capturing the bigger picture behind Gold prices. It unveils long-term trends and patterns, offering valuable insights into the overarching market trajectory. However, effective strategy implementation requires a granular approach. Traders must look beyond the monthly variety and delve into shorter time frames to gain a more detailed and immediate understanding of market conditions.

    Gold Trading Strategies

    Consider a scenario where a trader exclusively relies on the monthly chart to identify trends. They may miss out on shorter-term fluctuations and fail to capitalize on potential opportunities for timely entries or exits. This is where the importance of adopting a consistent framework comes into play. By integrating shorter time frames into their analysis, traders can synchronize their strategies with the evolving nature of Gold market conditions.

    Adapting to market changes efficiently is a hallmark of successful traders. The ability to switch between time frames allows traders to stay agile and responsive to shifting dynamics. For instance, a longer-term trend may be evident on the monthly chart, but a deeper dive into daily or hourly charts could reveal shorter-term trends or potential reversals.

    In conclusion, understanding time frames in Gold trading is not just a technical aspect; it’s a strategic imperative. Traders who embrace the multi-faceted approach to analyzing Gold market conditions, integrating both monthly and shorter time frames, are better positioned to navigate the intricate landscape successfully. As we delve into Gold Trading Strategies, this emphasis on time frames serves as a guiding principle, ensuring traders are equipped to make well-calibrated decisions aligned with the ever-changing rhythms of the Gold market.

    Gold Trading Strategies

    As we delve into the heart of Gold Trading Strategies, it becomes evident that success hinges not just on the specific strategy employed, but on its harmonious alignment with the prevailing market condition. The intricate dance between short-term and long-term trends emerges as a pivotal factor, shaping the trajectory of successful Gold trading endeavors.

    The market condition is akin to the heartbeat of Gold trading, and traders must attune their strategies to its rhythm. While there is a myriad of strategies available, their effectiveness lies in their adaptability to the ever-shifting dynamics of Gold market conditions. The astute trader recognizes that a one-size-fits-all approach rarely leads to sustainable success.

    The relationship between short-term and long-term trends unveils the essence of strategic gold trading. When the short-term trend aligns harmoniously with its longer-term counterpart, traders are poised to capitalize on a golden opportunity—the age-old adage of ‘buying low and selling high.’ This classic approach aligns with the momentum created by trends, allowing traders to ride the waves of increasing highs and lows for optimal gains.

    However, the ebb and flow of the Gold market are not always characterized by clear trends. Range-bound periods introduce a different set of dynamics that necessitate a nuanced and strategic approach. During these phases, where Gold prices move within a defined range, traders must adapt their strategies accordingly.

    Gold Trading Tip #3 emphasizes the importance of recognizing range-bound periods and adjusting strategies appropriately. Instead of adhering strictly to the ‘buy low and sell high’ mantra, traders must employ a more refined technique. Closing long positions at highs becomes a strategic move, allowing traders to lock in profits during the upward swing. Simultaneously, the exploration of short positions—betting on the potential downward movement—becomes a tactical consideration.

    This nuanced approach during range-bound periods demonstrates the flexibility required in successful Gold trading. Traders are not confined to a singular direction; instead, they pivot their strategies to align with the prevailing market condition. It’s a delicate dance of adaptability, where the skill lies not just in identifying trends but in navigating the transitional periods between trends and range-bound phases.

    In essence, Gold Trading Strategies transcend the rigidity of fixed methodologies. The key is to recognize the ever-changing nature of market conditions and tailor strategies to match. Whether it’s riding the waves of trends during harmonious alignments or strategically navigating the peaks and troughs of range-bound periods, successful traders remain attuned to the dynamic pulse of Gold trading.

    As we venture further into the world of Gold Trading Strategies, this emphasis on adaptability and strategic alignment serves as a guiding principle. It encourages traders to approach Gold not as a static entity but as a dynamic force, and by doing so, they position themselves to optimize returns and achieve lasting success in the ever-evolving landscape of Gold trading.

    Simplifying Market Behaviors

    In the intricate tapestry of Gold trading, the ability to simplify market behaviors is a skill that distinguishes the adept trader from the rest. Breaking down the complex and dynamic nature of market conditions into three distinct types—Trend, Range/Mean-Reversion, and Breakouts—offers a roadmap that guides traders through the multifaceted journey of Gold trading. This simplified approach serves as a beacon, illuminating the path to effective decision-making and robust risk management.

    The first pillar in simplifying market behaviors is identifying the overarching trend. Trends, characterized by directional movements, lay the foundation for strategic decision-making. Understanding whether Gold is in an upward or downward trend provides traders with a crucial perspective. The concept of higher-highs and higher-lows in an uptrend or lower-lows and lower-highs in a downtrend becomes a guiding principle for those navigating the trend landscape.

    The second facet is the Range/Mean-Reversion phase. During these periods, Gold prices exhibit a lack of clear direction, oscillating within a defined range. Recognizing these phases allows traders to pivot their strategies, focusing on mean-reversion tactics. In range-bound markets, the age-old strategy of ‘buying low and selling high’ takes center stage, emphasizing the cyclical nature of Gold prices as they revert to mean levels.

    The third dimension is Breakouts, representing moments of transition from one market condition to another. Breakouts occur when new information is priced into the market, leading to a shift from a range-bound phase to a new trend or vice versa. Traders keen on identifying breakout moves can position themselves strategically to capitalize on emerging trends, securing a potential advantage in the evolving Gold market landscape.

    The key to successful Gold trading lies not in adhering rigidly to a single strategy but in the ability to tailor approaches to specific market conditions. This tailored approach is crucial during directional trends, where aligning with the momentum is paramount. In contrast, during range-bound phases, adapting to the cyclical nature of Gold prices becomes the strategic focus.

    Recognizing market conditions provides a solid foundation for effective decision-making. Traders armed with the knowledge of whether Gold is in a trend, range, or breakout phase can calibrate their strategies accordingly. This awareness minimizes the risk of employing mismatched tactics, ensuring that trading decisions align with the prevailing market dynamics.

    Moreover, the recognition of market conditions is a cornerstone of robust risk management. By tailoring risk management strategies to the specific characteristics of trends, range-bound periods, or breakout moves, traders can safeguard their positions against unexpected market shifts. This proactive risk management approach serves as a shield, fortifying traders against potential pitfalls in the volatile world of Gold trading.

    In conclusion, simplifying market behaviors in Gold trading is not about oversimplification but about distilling complex dynamics into actionable insights. Recognizing trends, range-bound phases, and breakout moves empowers traders to navigate the nuanced landscape with confidence. As we continue our exploration of Gold Trading Strategies, this emphasis on simplification remains a guiding principle, ensuring traders are equipped to decipher the ever-changing rhythm of the Gold market with precision and adaptability.

    Conclusion

    In conclusion, mastering Gold Trading Strategies is not only about choosing the right strategy but also about adapting to ever-changing market conditions. Whether you are navigating short-term trends or analyzing the broader market picture, the key is to align your approach with the prevailing conditions. By understanding the cyclical nature of gold prices, monitoring the US Dollar correlation, and implementing strategies that fit the market condition, you can optimize returns and achieve lasting success in Gold trading. Remember, success in precious metal trading lies in the ability to adapt and execute strategies tailored to the dynamic nature of the market.

    Click here to read our latest article on the Reserve Bank of New Zealand

    FAQs

    1. What are Gold Trading Strategies, and why are they important? Gold Trading Strategies are systematic approaches that traders use to navigate the complex landscape of Gold markets. These strategies are crucial for optimizing returns and adapting to various market conditions, ensuring effective decision-making.
    2. How does the cyclical nature of Gold prices impact trading strategies? Gold’s cycle sensitivity influences the choice of trading strategies. Recognizing whether Gold is in a trend or a range-bound phase allows traders to tailor their approaches, aligning with the prevailing market condition.
    3. Why is the correlation between the US Dollar and Gold significant in trading? The US Dollar and Gold correlation is pivotal as Gold is often traded in US Dollars. Understanding this relationship, especially the inverse correlation, is crucial for making informed trading decisions and predicting potential price movements.
    4. How do time frames play a role in Gold Trading? Analyzing Gold market conditions across different time frames is essential. While monthly charts offer a broader picture, shorter time frames are crucial for effective strategy implementation. Traders must adopt a consistent framework aligned with their strategies.
    5. What is the importance of aligning strategies with market conditions in Gold trading? Aligning strategies with market conditions is more critical than the specific strategy itself. Whether it’s a trend, range-bound phase, or breakout move, tailoring approaches to specific market conditions enhances the likelihood of success.
    6. How can traders capitalize on the relationship between short-term and long-term trends in Gold trading? Capitalizing on the alignment between short-term and long-term trends involves adhering to the principle of ‘buying low and selling high’ during trend phases. This classic strategy maximizes gains during periods of trend coherence.
    7. What is the significance of recognizing range-bound periods in Gold trading? Recognizing range-bound periods is crucial for a nuanced approach. During these phases, traders should consider closing long positions at highs and exploring short positions, adapting their strategies to the cyclical nature of Gold prices.
    8. How does breaking down market behaviors into specific types simplify Gold trading? Breaking down market behaviors into types such as Trend, Range/Mean-Reversion, and Breakouts simplifies the complex Gold trading landscape. This simplification provides traders with a clear framework for decision-making and risk management.
    9. Why is it essential to tailor strategies to specific market conditions in Gold trading? Tailoring strategies to specific market conditions ensures that traders are not employing a one-size-fits-all approach. Whether it’s following trends, adapting to range-bound periods, or identifying breakout moves, this tailored approach enhances strategy effectiveness.
    10. How does understanding Gold market conditions contribute to risk management in trading? Understanding Gold market conditions is integral to robust risk management. By aligning risk management strategies with the characteristics of trends, range-bound periods, or breakout moves, traders can safeguard their positions against unexpected market shifts.

    Click here to read more about Gold Trading Strategies

  • Reserve Bank of New Zealand: Unveiling its Economic Influence – A comprehensive guide

    Reserve Bank of New Zealand: Unveiling its Economic Influence – A comprehensive guide

    At the heart of New Zealand’s economic stability stands the Reserve Bank of New Zealand (RBNZ), a formidable institution with a rich history and a pivotal role in shaping the nation’s economic landscape. Established in 1934, the RBNZ has evolved to become the guardian of price stability and a driver of sustainable economic growth. In this comprehensive guide, we delve into the intricate facets of the RBNZ, from its historical journey to the tools it wields, exploring its impact on the New Zealand economy.

    The Reserve Bank of New Zealand (RBNZ) takes center stage in the economic narrative of the Kiwi nation. As the central bank, its influence permeates through various sectors, guiding the course of economic prosperity. Established in 1934 amid the economic turmoil of the Great Depression, the RBNZ was tasked with ensuring financial stability and providing a mechanism for effective monetary policy. Over the years, its mandate has evolved, with a specific focus on maintaining price stability and fostering sustainable economic growth.

    Reserve Bank of New Zealand

    History of the Reserve Bank of New Zealand

    In the wake of the Great Depression’s economic upheaval, the Reserve Bank of New Zealand (RBNZ) emerged as a beacon of stability, poised to anchor the nation’s financial resilience. Established in 1934, the RBNZ was bestowed with a multifaceted mandate, embodying control over currency issuance, regulation of the banking system, and the pivotal setting of interest rates.

    The early years of the RBNZ saw it navigating through the tumultuous aftermath of the Great Depression, employing its broad mandate to stabilize the country’s economic foundations. As a guardian of financial stability, the bank played a pivotal role in regulating the issuance of currency, ensuring the robustness of the banking system, and wielding influence over interest rates.

    However, a transformative juncture awaited the RBNZ in 1989, marking a legislative evolution that would redefine its mission. The enactment of the Reserve Bank of New Zealand Act became the bedrock of this metamorphosis, crystallizing a commitment to a more focused and targeted approach to monetary policy. This legislative refinement pivoted the bank’s mandate, elevating the importance of price stability to the forefront of its objectives.

    This pivotal turning point in 1989 represented more than a mere legislative adjustment; it signified a strategic commitment to navigating the economic landscape with precision. By prioritizing price stability, the RBNZ embraced a role as a proactive architect of economic equilibrium, steering the nation through the intricacies of monetary policy with a refined and targeted vision.

    The evolution of the RBNZ’s mandate encapsulates not just a historical timeline but a saga of adaptation and commitment to the economic well-being of New Zealand. From the broad responsibilities of its inception to the refined focus on price stability, the bank’s history is a testament to its resilience and capacity to evolve in tandem with the ever-changing economic currents.

    Current Shareholders

    In the intricate tapestry of financial governance, the Reserve Bank of New Zealand (RBNZ) unfolds as a unique narrative of ownership, where the standard conventions give way to a distinctive paradigm. At its core, the RBNZ stands not as a detached financial entity but as a bastion of stability, intricately linked to the fate of New Zealand’s economic landscape.

    This distinctive paradigm finds its expression in the ownership structure, a structure that distinguishes the RBNZ from conventional financial institutions. Here, the New Zealand government assumes the role of the sole shareholder, with the Minister of Finance standing as the custodian of this singular bond. Far from a ceremonial role, this ownership model intertwines the destinies of the RBNZ and the nation, creating a bond that transcends the transactional nature of traditional shareholder relationships.

    Yet, this unique ownership structure is not a mere symbolic gesture; it is a strategic alignment of objectives. It is a conscious choice to anchor the RBNZ’s fate with the broader national interest. The tethering of the RBNZ to the government serves as a tangible commitment to its mandate, emphasizing the prioritization of the nation’s economic well-being over the pursuit of private profits.

    This commitment is further underscored by the symbiotic financial relationship established through this ownership model. Any profits generated by the RBNZ become a national asset, a contribution to the state’s financial health. This financial interdependence is a reflection of a profound commitment—a commitment to public service, economic resilience, and the well-being of every New Zealander.

    In an era where financial institutions often grapple with the tension between private profit motives and public responsibilities, the RBNZ stands as a unique entity. Its destiny is intricately woven with the economic prosperity of New Zealand, and its ownership model becomes a beacon of stability, signaling a resolute dedication to the nation’s financial well-being.

    Appointment of the Board and Governor

    Within the hallowed halls of the Reserve Bank of New Zealand (RBNZ), the resonance of effective governance reverberates, finding its crescendo in the meticulously appointed ensemble known as the board of directors. A cornerstone of the RBNZ’s modus operandi, this assembly of directors, carefully curated by the discerning eye of the Minister of Finance, forms the bedrock of oversight—a collective entrusted with the pivotal task of guiding the RBNZ in unwavering alignment with its mandated objectives.

    At the epicenter of this governance symphony stands the Governor of the Reserve Bank, a figurehead of profound significance in the economic narrative of New Zealand. Endowed with the responsibility of shepherding the institution through the intricate landscape of monetary policy, this seasoned professional assumes a role of unparalleled importance. With a tenure of five years, coupled with the prospect of reappointment, the Governor becomes the maestro directing the harmonious orchestration of the RBNZ’s operations, from the implementation of monetary policy to the minutiae of day-to-day functions.

    The governance paradigm of the RBNZ is not a mere bureaucratic structure; it is a strategic ensemble, finely tuned to ensure the effective execution of the bank’s mandate. Each member of the board represents a distinct note in this orchestrated symphony, contributing to the harmonious pursuit of economic stability and growth outlined in the RBNZ’s mandate. Their collective expertise and oversight create a dynamic synergy, a governance ballet that unfolds with precision and purpose.

    As guardians of the economic well-being of New Zealand, the board and Governor form an alliance that transcends mere administrative roles. They become custodians of the nation’s financial resilience, stewards of a legacy that weaves governance excellence into the very fabric of the RBNZ’s existence. In the grand tapestry of economic orchestration, the appointment of the board and Governor emerges as a testament to the RBNZ’s commitment to not just meet but exceed the expectations bestowed upon it.

    Mandate and Tools for Execution

    Nestled within the constitutional fabric of New Zealand, the Reserve Bank of New Zealand (RBNZ) wields a mandate as clear as the Southern Hemisphere’s skies—maintain price stability and propel sustainable economic growth. This mandate, etched in the national narrative, is not a mere proclamation but a guiding principle that steers the RBNZ through the complex currents of economic governance.

    At the forefront of this strategic expedition is the Official Cash Rate (OCR), a nuanced instrument that assumes the role of the RBNZ’s conductor in the symphony of monetary policy. The OCR, akin to the beating heart of the nation’s financial landscape, dictates the interest rate banks pay on overnight loans from the Reserve Bank. Its influence transcends mere numbers on a chart; it becomes the pivot point shaping borrowing costs, influencing spending patterns, and orchestrating the delicate dance of inflation.

    Reserve Bank of New Zealand

    The RBNZ’s adept navigation of interest rate hikes unfolds as a saga of strategic prowess. A meticulous adjustment of the OCR becomes the captain’s wheel steering the economic ship through diverse cycles. It’s a balancing act where the imperative of fostering growth harmonizes with the steadfast commitment to stable prices. The historical tableau of interest rate hikes and their impact on inflation becomes a testament to the RBNZ’s role as not just an observer but a maestro orchestrating the nation’s economic trajectory. The lagging effect, influenced by external factors, adds layers of complexity to this economic symphony, creating a dynamic interplay of cause and effect.

    Yet, the RBNZ’s toolkit extends beyond the realm of interest rate adjustments. Enter the realm of open market operations—a strategic deployment influencing the money supply, sculpting the contours of interest rates, and guiding economic activity. The regulatory tools wielded by the RBNZ, from setting capital requirements for banks to vigilant monitoring of financial system liquidity, emerge as the unsung heroes in the saga of financial stability.

    In this strategic symphony, the RBNZ becomes not just a custodian of monetary policy but a guardian of economic equilibrium. Each tool in its arsenal becomes a note in the grand composition of economic governance, a note that resonates through the markets, banks, and the broader financial landscape of New Zealand. The mandate and tools for execution are not static elements; they are dynamic forces that respond to the ever-changing cadence of the global and domestic economic landscape, showcasing the RBNZ’s resilience, adaptability, and commitment to the economic prosperity of New Zealand.

    Conclusion

    In conclusion, the Reserve Bank of New Zealand emerges not merely as a financial institution but as a steward of economic prosperity. Its historical journey, distinctive ownership structure, and strategic tools collectively position the RBNZ as a key player in shaping the New Zealand economy. As it steers through interest rate hikes, fosters financial stability, and navigates the complexities of monetary policy, the RBNZ remains committed to its mandate, unveiling its profound economic influence on the Kiwi nation. This comprehensive guide serves as a compass for those seeking to decipher the intricate workings of the Reserve Bank of New Zealand, a guide to understanding its economic influence.

    Click here to read our latest article on The Impact of The Dynamic Influence of the South African Reserve Bank

    FAQs

    1. What is the primary mandate of the Reserve Bank of New Zealand (RBNZ)? The primary mandate of the RBNZ is to maintain price stability and promote sustainable economic growth.
    2. What role does the Official Cash Rate (OCR) play in the RBNZ’s monetary policy? The OCR, as the interest rate that banks pay on overnight loans, is a pivotal instrument shaping borrowing costs, spending patterns, and influencing inflation in the RBNZ’s strategic economic governance.
    3. How does the RBNZ navigate interest rate hikes and their impact on inflation? The RBNZ strategically adjusts the OCR, serving as the captain’s wheel steering the economy through diverse cycles, balancing the imperative of fostering growth with a commitment to stable prices.
    4. What is the significance of the lagging effect in the historical view of interest rate hikes and inflation? The lagging effect adds complexity to the economic symphony, illustrating how the RBNZ’s decisions play a crucial role in shaping the economic trajectory with a delayed impact influenced by external factors.
    5. Beyond interest rate adjustments, what tools does the RBNZ deploy in economic governance? The RBNZ utilizes open market operations to influence the money supply, sculpt interest rates, and guide economic activity. Regulatory tools, including setting capital requirements and monitoring financial system liquidity, contribute to maintaining financial stability.
    6. How does the RBNZ balance the need for growth with the imperative of maintaining stable prices? The RBNZ achieves this delicate balance by strategically adjusting the OCR, ensuring that economic growth is fostered while simultaneously adhering to the commitment of stable prices.
    7. What is the governance structure of the RBNZ, and who appoints its board of directors? Governance is overseen by a board of directors appointed by the Minister of Finance. The board, including the Governor, ensures the RBNZ operates in accordance with its mandate.
    8. Who is responsible for implementing monetary policy and overseeing the day-to-day operations of the RBNZ? The Governor of the Reserve Bank, appointed for a five-year term with the possibility of reappointment, assumes a central role in implementing monetary policy and managing day-to-day operations.
    9. How does the RBNZ’s ownership structure differ from conventional banks? The RBNZ is wholly owned by the New Zealand government, with the Minister of Finance serving as the sole shareholder. This unique model ensures that profits are channeled back to the government.
    10. In the economic symphony conducted by the RBNZ, what role do each of its tools play? Each tool in the RBNZ’s economic toolkit, from the OCR to regulatory measures, contributes as a note in the grand composition of economic governance, resonating through the financial landscape of New Zealand.

    Click here to read our latest article on the Reserve Bank of New Zealand

  • Understanding The Impact of The Dynamic Influence of the South African Reserve Bank on Economic Prosperity

    Understanding The Impact of The Dynamic Influence of the South African Reserve Bank on Economic Prosperity

    In the dynamic economic landscape of South Africa, one entity stands as a linchpin, exerting a profound influence on the nation’s economic trajectory—the South African Reserve Bank (SARB). Established on June 30, 1921, the SARB is the oldest central bank in Africa, playing a pivotal role in shaping the economic framework of the country. In this comprehensive exploration, we delve into the intricate facets of the South African Reserve Bank, unraveling its historical roots, unique shareholder structure, policy decisions, and the far-reaching impact it wields on economic prosperity, especially concerning the South African Rand (ZAR) and the repo rate.

    The Birth of the South African Reserve Bank (SARB)

    The roots of economic stability in South Africa intertwine with the compelling narrative of the South African Reserve Bank (SARB). In the aftermath of the economic tumult following World War I, a need arose for a stabilizing force, an independent monetary authority that could navigate the currency fluctuations that characterized the post-war landscape. This need gave birth to the SARB on June 30, 1921, with a distinctive mandate—to be the cornerstone of stability for the nation’s currency.

    The economic aftermath of World War I created a landscape fraught with currency uncertainties. South Africa, like many nations, faced the challenge of stabilizing its currency amidst the fluctuating tides of post-war reconstruction. The establishment of the SARB was a strategic response to this challenge, a commitment to providing a robust and independent monetary framework that could weather the storms of economic uncertainty.

    During its formative years, the SARB operated as a privately-owned institution, a period marked by its initial steps into the complex realm of monetary policy and economic stability. However, recognizing the evolving needs of the nation and the role of the SARB in shaping the economic trajectory, a transformative phase unfolded in 1945. The decision to nationalize the SARB marked a significant turning point, bringing the institution directly under the control of the South African government.

    This transition was more than a bureaucratic realignment; it represented the maturation of the SARB into a crucial pillar of economic governance. The nationalization underscored the government’s recognition of the pivotal role the SARB played in safeguarding the nation’s financial interests and maintaining stability in the face of economic challenges.

    South African Reserve Bank

    Being the oldest central bank on the African continent, the SARB stands as a testament to resilience and adaptability. It weathered the storms of the Great Depression, navigated the challenges posed by World War II, and played a critical role in the complex socio-economic landscape of the apartheid era. The transition to a democratic government marked another chapter in its storied history, a period where the SARB continued to evolve and adapt to the changing needs of the nation.

    The resilience of the SARB is not merely a historical footnote; it is a living legacy that continues to shape South Africa’s economic present and future. As an institution that has thrived amidst dynamic economic challenges, the SARB stands as a beacon of stability, a testament to the foresight of its founders and the adaptability that has defined its journey through the annals of time.

    Shareholders of the South African Reserve Bank (SARB)

    In the realm of central banking, the South African Reserve Bank (SARB) charts its own course with a distinctive shareholding structure that sets it apart from conventional counterparts. Unlike the typical central bank model, the SARB stands as a publicly owned entity, boasting a diverse shareholder base comprising over 650 individuals and entities. However, the true essence of its uniqueness lies not merely in the number of shareholders but in the carefully crafted limitations that define their rights, ensuring a delicate equilibrium between public and private interests.

    The SARB’s shareholding structure is a testament to the commitment to maintain the bank’s independence, a core principle that shapes its decision-making processes and policy formulations. Strict legal constraints serve as the guardians of this independence, preventing shareholders from wielding undue influence over the critical policy decisions that steer the nation’s economic course.

    One distinctive limitation imposed on shareholders is the cap on individual ownership. No shareholder or associated group is permitted to own more than 10,000 shares individually. This restriction, while seemingly numerical, serves as a safeguard against concentrated influence. By preventing any single entity from amassing a disproportionate share of ownership, the SARB ensures that no individual or group can sway the bank’s agenda in a manner contrary to the broader interests of the nation.

    Another pivotal restriction is imposed on non-resident shareholders and their associates, who face a cap on holding more than 40% of the total issued shares. This geographical limitation is strategic, aligning with the broader goal of maintaining the SARB’s autonomy in the face of global economic forces. By preventing excessive foreign influence, the SARB secures its role as a guardian of South Africa’s economic interests, ensuring that decisions are made with a keen understanding of the nation’s unique economic dynamics.

    These limitations on shareholder rights are not mere regulatory hurdles; they are the pillars that support the SARB’s commitment to independence and neutrality. They ensure that the interests of the broader public and the nation’s economic stability take precedence over individual or concentrated interests. The delicate balance between public and private interests, as orchestrated by the SARB’s shareholding structure, becomes a critical element in preserving the integrity and effectiveness of this venerable institution.

    In essence, the SARB’s shareholders play a role that extends beyond mere ownership—they become stewards of an institution entrusted with the economic well-being of a nation. The shareholding structure becomes a tapestry woven with the threads of accountability, ensuring that the SARB remains true to its mandate, free from the undue influence that might compromise its ability to act in the best interests of South Africa and its citizens.

    The Mandate of the South African Reserve Bank (SARB)

    At the very core of South Africa’s economic governance lies the South African Reserve Bank (SARB), an institution whose mandate is not a mere bureaucratic formality but a constitutional commitment enshrined in the fabric of the Republic. Embedded within the Constitution of the Republic of South Africa, Section 224(1) serves as the lodestar, succinctly outlining the SARB’s primary objective—to “protect the value of the currency in the interest of balanced and sustainable economic growth.” This seemingly straightforward mission statement unfurls a tapestry of responsibilities that position the SARB as a linchpin in the nation’s economic machinery.

    The overarching goal of protecting the value of the currency translates into a multi-faceted role that extends far beyond the traditional confines of a central bank. At the heart of this mandate is the commitment to maintain price stability, achieved through the careful orchestration of monetary policy. The SARB’s decisions regarding interest rates, money supply, and other monetary instruments are all calibrated with the singular aim of fostering an environment conducive to balanced and sustainable economic growth.

    However, the SARB’s responsibilities extend beyond the realm of monetary policy. It assumes the role of a guardian overseeing the stability of the South African financial system—an imperative task in an era marked by the complexities of global finance. As the issuer of banknotes and coins, the SARB literally puts the nation’s currency into circulation, a tangible expression of its commitment to ensuring the reliability and integrity of the monetary system.

    The symbiotic relationship between the SARB and the government takes form in the role of the central bank as the official banker for the government. This strategic alliance goes beyond the routine handling of financial transactions; it underscores the interdependence between economic policy formulation and its execution. By providing banking services for commercial banks, the SARB becomes not just a regulator but an active participant in the intricate dance of the financial sector.

    A critical facet of the SARB’s mandate is the management of the country’s gold and foreign exchange reserves. In an era of global interconnectedness, these reserves become strategic assets, serving as a buffer against economic shocks and providing the nation with the flexibility to navigate the dynamics of the international economic landscape.

    In essence, the mandate of the SARB is a symphony of responsibilities, each note contributing to the harmony of South Africa’s economic well-being. It is a commitment to not just preserve the value of the currency but to actively cultivate an environment where economic growth is not just a momentary surge but a sustained and balanced progression.

    As we delve into the intricacies of the SARB’s mandate, it becomes evident that its role transcends the conventional boundaries of a central bank. It emerges as a dynamic force, a key player in the economic narrative of South Africa, wielding its constitutional mandate with precision and foresight to navigate the complexities of the modern economic landscape.

    Dividends

    In the intricate financial ecosystem of the South African Reserve Bank (SARB), dividends play a distinctive role—a role deeply entwined with the institution’s overarching commitment to its constitutional mandate. Unlike conventional entities driven by profit motives, the SARB operates not as a profit-centric entity but as a custodian of economic stability. However, within this framework, a unique interplay unfolds, involving private shareholders and a carefully calibrated dividend structure.

    The SARB’s private shareholders, though not the primary drivers of the institution’s objectives, hold a stake in its operations. This stake entitles them to a share of the financial returns generated by the SARB, albeit within the bounds of a legally mandated cap. The dividend cap, a prudent financial constraint, is set at 10 cents per share per annum. This limitation serves a dual purpose—it ensures that private shareholders receive a return on their investment while preventing an undue accumulation of profits within the SARB’s financial structure.

    This distinctive dividend structure becomes a testament to the SARB’s commitment to its core objectives, delineated in the Constitution of the Republic of South Africa. The priority is not the amassing of wealth or the pursuit of profit for its own sake; rather, it is the protection of the value of the currency and the facilitation of balanced and sustainable economic growth. The dividend structure acts as a financial mechanism that aligns the interests of private shareholders with the broader economic objectives, creating a symbiotic relationship that resonates with the institution’s unique character.

    Crucially, the dividends paid to private shareholders are not an end in themselves. Beyond the capped return, any surplus profits generated by the SARB flow back to the South African government. This financial disposition underscores the institution’s role as a public entity, reinforcing its commitment to channel financial gains towards the broader welfare of the nation. It transforms the SARB’s financial activities into a conduit through which economic prosperity is not concentrated but diffused across the broader spectrum of societal needs.

    In essence, while the SARB’s dividend dynamics may echo the financial intricacies of profit-oriented entities, they do so with a distinct purpose. The financial returns, carefully calibrated and capped, serve as a mechanism that aligns private interests with public objectives, creating a financial symbiosis that echoes the institution’s commitment to economic stability and growth.

    As we unravel the layers of the SARB’s financial landscape, the dividend dynamics emerge not as a departure from its core principles but as a harmonious chord within the broader symphony of economic governance. They serve as a reminder that even in the financial realm, the SARB’s priorities are grounded in the pursuit of a balanced and prosperous economic future for South Africa.

    Impact of Policy Decisions on the South African Rand (ZAR)

    South African Reserve Bank
    SA INTEREST RATE VS. SA INFLATION
    Source: DFX

    In the intricate tapestry of South Africa’s economic landscape, the South African Reserve Bank (SARB) emerges as the maestro orchestrating the nuanced dynamics of the South African Rand (ZAR). At the heart of this orchestration are the pivotal policy decisions, with the repo rate standing as a fundamental instrument that wields a profound influence on the ebb and flow of the ZAR.

    The repo rate, a linchpin in the SARB’s monetary policy toolkit, serves as a lever that intricately connects with inflation, spending patterns, and, consequently, the trajectory of the ZAR. It is in the delicate dance of adjusting this rate that the SARB navigates the complexities of maintaining price stability while fostering economic growth.

    Picture a scenario where inflation surges beyond the SARB’s targeted range. In response, the SARB might opt for a strategic maneuver—raising the repo rate. This tactical decision, while curbing inflation by making borrowing more expensive and reducing spending, introduces a nuanced challenge. The allure of higher interest rates attracts foreign investors seeking enhanced returns, a factor that can sway the value of the ZAR.

    Conversely, a decision to lower the repo rate becomes a catalyst for stimulating economic growth. By reducing borrowing costs, this move encourages spending and investment. However, it’s a double-edged sword. The potential consequence of increased inflation and a weakened ZAR emerges as foreign investors, enticed by higher returns elsewhere, may redirect their capital.

    The intricate interplay of these policy decisions unveils the SARB’s delicate balancing act—maintaining a harmonious blend of price stability and safeguarding the ZAR’s value, all while fostering an environment of balanced and sustainable economic growth. The repo rate, as the focal point of this economic ballet, embodies the strategic considerations and trade-offs inherent in the SARB’s role.

    As we delve into the dynamics of SARB’s policy impact on the ZAR, it becomes evident that each decision is not just a financial adjustment but a strategic move with far-reaching consequences. The currency currents respond to the subtle shifts orchestrated by the SARB, and in this nuanced dance, the central bank navigates the ever-shifting landscape, striving to steer South Africa toward economic prosperity and stability.

    Monetary Policy Decisions, Economic Growth in South Africa

    In the intricate mosaic of South Africa’s economic canvas, the South African Reserve Bank (SARB) emerges not merely as a monetary authority but as a masterful conductor shaping the symphony of economic growth. At the heart of this orchestration are the subtle yet potent movements of the repo rate, the SARB’s strategic tool in navigating the confluence of monetary policy decisions and the trajectory of economic prosperity in South Africa.

    Delving deeper into the dynamics of these decisions unveils a symbiotic relationship between the SARB’s strategic choices and the broader economic landscape. As the SARB steers the repo rate, its influence reverberates through the corridors of consumer spending, business investment, and the overarching tapestry of economic activity.

    The repo rate, as a lever in the hands of the SARB, becomes a pivot point influencing the cost of borrowing and, by extension, the propensity for spending and investment. A nuanced understanding of this relationship is pivotal for those navigating the economic currents of South Africa. It goes beyond the realm of financial jargon; it is a narrative of how the SARB’s decisions ripple through the fabric of the nation’s economic growth.

    The central role of the SARB becomes a balancing act—one that transcends the immediate impact on inflation and the ZAR. It is a delicate equilibrium where each adjustment of the repo rate carries implications for the broader economic health of South Africa. For consumers, it may mean variations in interest rates on loans and mortgages. For businesses, it can influence the cost of capital and the decisions surrounding expansion or contraction.

    As we dissect this intricate relationship between monetary policy decisions and economic growth, it becomes evident that the SARB is not merely a spectator but an active participant in sculpting South Africa’s economic destiny. The repo rate, as the tool of choice, is not wielded in isolation; its impact cascades through the intricate network of economic activities, weaving a narrative that goes beyond the realms of interest rates.

    For those keen on deciphering the economic tapestry of South Africa, a nuanced understanding of the SARB’s role is indispensable. It is a narrative where monetary policy decisions are not just numbers on a chart but a dynamic force shaping the contours of economic growth. The repo rate, in the skilled hands of the SARB, becomes a brushstroke in the evolving portrait of South Africa’s economic prosperity, a portrait where each stroke contributes to the vibrant and resilient canvas of the nation’s economic story.

    Conclusion

    In conclusion, the South African Reserve Bank emerges as a cornerstone of economic stability and growth in South Africa. Its historical journey, unique shareholder structure, and impactful policy decisions make it a linchpin in the nation’s economic framework. Understanding the dynamic influence of the SARB on economic prosperity, especially concerning the South African Rand and the repo rate, is not just an academic pursuit but a strategic imperative for traders, investors, and anyone keen on comprehending the nuances of South Africa’s economic landscape. The SARB’s decisions reverberate beyond its boardrooms, shaping the narrative of a nation’s economic journey.

    Click here to read our latest article on Master the 4 Key Yield Curve Regimes

    FAQs

    1. What is the primary objective of the South African Reserve Bank (SARB)? The primary objective of the SARB, as outlined in Section 224(1) of the Constitution of the Republic of South Africa, is to “protect the value of the currency in the interest of balanced and sustainable economic growth.”
    2. How does the SARB maintain its independence while having shareholders? The SARB, despite having shareholders, maintains independence through strict legal constraints. Shareholders are limited in their rights, with no individual or group allowed to own more than 10,000 shares, and non-residents are restricted from holding more than 40% of the total issued shares.
    3. What historical events has the SARB weathered since its establishment in 1921? The SARB, as the oldest central bank in Africa, has weathered significant events, including the Great Depression, World War II, the apartheid era, and the transition to a democratic government in South Africa.
    4. How does the SARB contribute to economic growth in South Africa? The SARB contributes to economic growth through its monetary policy decisions, including managing the repo rate. By influencing borrowing costs, consumer spending, and business investment, the SARB plays a crucial role in shaping the economic landscape.
    5. What is the repo rate, and how does it impact the South African Rand (ZAR)? The repo rate is a fundamental tool used by the SARB to control inflation and stabilize the ZAR. Changes in the repo rate influence borrowing costs, spending patterns, and the overall trajectory of the ZAR.
    6. How are dividends handled in the SARB, considering it operates not for profit? While the SARB operates not for profit, its private shareholders are entitled to limited dividends, capped at 10 cents per share per annum. Profits beyond this amount are directed back to the South African government.
    7. What role do shareholders play in the SARB, and how is their influence regulated? Shareholders play a role in the SARB as owners, but their influence is regulated by legal limitations. They cannot exert power over the bank’s policy decisions, ensuring the SARB’s independence.
    8. How does the SARB balance the repo rate to foster economic growth while maintaining price stability? The SARB faces a delicate balancing act in its monetary policy decisions. It adjusts the repo rate to maintain price stability and protect the ZAR’s value while fostering balanced and sustainable economic growth.
    9. How does the SARB’s mandate align with the Constitution of the Republic of South Africa? The SARB’s mandate, outlined in the Constitution, aligns with the broader objective of protecting the value of the currency in the interest of balanced and sustainable economic growth.
    10. In what ways do the SARB’s policy decisions impact individuals and businesses in South Africa? The SARB’s policy decisions, particularly those related to the repo rate, impact individuals and businesses by influencing interest rates on loans, mortgages, and the cost of capital. It plays a pivotal role in shaping economic conditions for both consumers and businesses in South Africa.

    Click here to learn more about South African Reserve Bank

  • Master the 4 Key Yield Curve Regimes: A Proven Tool for Stock Market Success

    Master the 4 Key Yield Curve Regimes: A Proven Tool for Stock Market Success

    Introduction: The Intersection of Bonds and Stocks

    You might have heard of the yield curve, a term often thrown around in financial circles. But did you know that understanding yield curve regimes can give you an unparalleled edge in the stock market? This guide will demystify the concept and empower you to use yield curves as a robust tool for your investment strategies.

    To grasp the significance of yield curves, it’s crucial to understand the basic relationship between bonds and stocks. Bonds are debt securities that pay periodic interest and return the principal amount at maturity. Stocks are shares in a company, offering a stake in its assets and earnings. Both markets are vast and multi-faceted, but they are more interconnected than most investors realize. Understanding one can yield insights (pun intended) into the other.

    Understanding Yield Curve Regimes

    The Concept of Yield Curve

    At its core, a yield curve is a graphical representation of interest rates for bonds with similar credit quality but varying maturity dates. It’s a fundamental tool in finance that provides critical insights into the state of the economy and can serve as a powerful predictor of future economic trends.

    Yield Curve Regime

    The Traditional Yield Curve

    Traditionally, the yield curve exhibits an upward-sloping shape, which means that longer-term bonds tend to offer higher yields compared to their shorter-term counterparts. This upward slope is a reflection of a fundamental principle in finance: investors generally expect a higher return for tying up their money in longer-term investments. In other words, the longer you lend your money, the more compensation you should receive in the form of higher interest rates.

    The Anomalies: Shifting, Flattening, and Inverting

    While the traditional yield curve provides a valuable framework, it’s crucial to understand that the yield curve is not static. It can morph and transform due to a variety of factors, including changes in the broader economy, shifts in interest rates set by central banks, and fluctuations in investor sentiment.

    Flattening Yield Curve: A Cautionary Tale

    In the realm of finance, few phenomena are as closely scrutinized and debated as the flattening yield curve. This intriguing occurrence takes place when the once-substantial gap between short-term and long-term interest rates narrows significantly. In a flattening yield curve scenario, investors notice that longer-term bonds offer only marginally higher yields than their shorter-term counterparts. The implications of this shift are profound, often sparking vigorous discussions about economic conditions and the potential headwinds that lie ahead.

    Economic Anticipation

    The flattening yield curve often serves as a canary in the economic coal mine. When investors observe this phenomenon, they begin to speculate about the broader economic landscape. The narrowing gap between short and long-term interest rates implies a growing consensus among investors that the economy may be in for a period of slower growth. It’s akin to a collective pause, as if the financial world is bracing itself for an impending storm.

    Signal of Caution

    For investors, a flattening yield curve is akin to a flashing caution sign. It’s a signal that the road ahead may be a bit rocky. Historically, periods of yield curve flattening have often been followed by economic slowdowns or contractions. Investors interpret this shift as a sign that potential economic headwinds may be on the horizon. It prompts a cautious approach to investments, with many market participants adopting a defensive posture to safeguard their portfolios.

    Inverted Yield Curve: The Recession Harbinger

    An inverted yield curve is a rare but dramatic occurrence in the financial world. It’s a moment when the short-term interest rates offered by bonds surpass the yields of their long-term counterparts. This phenomenon is not just attention-grabbing; it’s a reliable predictor of impending recessions.

    Yield Curve Regime

    Historical Omen

    Investors have learned to heed the warning of an inverted yield curve. Historically, virtually every instance of an inverted yield curve has been followed by an economic recession. It’s as if the yield curve becomes a crystal ball, foretelling economic troubles on the horizon. The predictive power of the inverted yield curve is so profound that it is often described as one of the most reliable recession indicators in the financial world.

    Cautious Approach

    When the yield curve inverts, it sets off alarm bells for investors. It’s interpreted as a clear signal that economic troubles may be looming, prompting a cautious approach to investments. Investors often seek refuge in assets considered safe havens, such as government bonds, and may reduce their exposure to riskier assets like stocks. It’s a time when the financial markets collectively brace themselves for an impending economic storm.

    Steepening Yield Curve: A Symphony of Optimism

    On the flip side of the yield curve spectrum lies the steepening yield curve, a scenario that unfolds during periods of economic optimism. This is when the gap between short-term and long-term interest rates widens, and it’s regarded as a symphony of confidence in the future.

    Economic Enthusiasm

    A steepening yield curve is a resounding vote of confidence in the economy. Investors anticipate robust economic growth and a favorable business climate, leading to higher expectations for corporate earnings. It’s a time when the financial world hums with enthusiasm, and the stock markets tend to respond positively to such developments.

    Bullish Sentiment

    Investors often adopt a bullish sentiment during a steepening yield curve regime. They view the widening gap between short and long-term rates as a positive sign that the economy is on a strong footing. This optimism can translate into increased investments in equities, as stocks are seen as well-positioned to capitalize on the anticipated economic expansion.

    In summary, these yield curve anomalies—flattening, inverted, and steepening—serve as essential tools for investors and economists alike. They provide critical insights into the ever-changing dynamics of the financial markets and serve as valuable signals for shaping investment strategies. Understanding these shifts can help investors navigate the complex terrain of economic cycles and make more informed decisions.

    Understanding these anomalies in the yield curve is essential for investors. It’s not merely a chart but a dynamic indicator that reflects the ebb and flow of economic conditions and investor expectations. Being able to interpret these shifts can help you make more informed investment decisions and navigate the complexities of financial markets.

    The Four Types of Yield Curve Regimes

    Certainly, let’s expand on each of the four yield curve regimes, highlighting their significance and implications while keeping the keywords in mind.

    Bear Steepener: Embracing Risk

    Bear Steepener is a yield curve regime that attracts the attention of investors in search of opportunities. In this scenario, long-term interest rates rise at a faster rate than short-term rates. It’s like a green light for investors, signaling that it’s time to embrace risk and consider venturing into the stock market with confidence.

    Risk-On Environment

    Bear Steepener often occurs in what is known as a “risk-on” environment. This term suggests that investors are more willing to take on higher levels of risk because they believe the economic conditions are favorable. In such an environment, stock markets tend to flourish, and investors flock to equities with the expectation of substantial returns.

    Favourable for Stocks

    For those seeking growth in their portfolios, a Bear Steepener regime is a welcoming sight. It’s typically considered favorable for stocks, especially those in cyclical sectors like materials, industrials, and consumer discretionary. These sectors tend to thrive during Bear Steepener phases due to the expectation of faster earnings growth.

    Bear Flattener: Navigating Expansion

    Bear Flattener is another yield curve regime that warrants attention, especially during times of economic expansion. In this scenario, short-term interest rates rise at a faster pace than their long-term counterparts. While this might seem like a cause for concern, it’s important to note that it can still be favorable for stocks.

    Expansion Phase

    Bear Flattener often unfolds during the expansion phase of the economic cycle. This is a period characterized by robust economic growth, low unemployment, and increasing corporate profits. Despite the name, this regime can be seen as a sign that the economy is on solid ground.

    Stocks Still Shine

    During a Bear Flattener regime, stocks can still shine. Investors often find comfort in the fact that the economy is expanding, which can bolster stock market performance. Tech stocks and real estate investments, in particular, tend to perform well in this environment, benefiting from the overall positive sentiment and growth prospects.

    Bull Steepener: Seeking Safety

    Bull Steepener is a yield curve regime that emerges during times of economic uncertainty. In this scenario, short-term interest rates decrease more rapidly than long-term rates. It’s a sign that investors are seeking safety amid a potentially rocky economic landscape.

    Risk-Off Situation

    Bull Steepener indicates a “risk-off” situation, where investors become more cautious due to uncertainties in the economic outlook. During these periods, the stock market may face headwinds, and investors tend to look for safer investment options.

    Caution Required

    While Bull Steepener may not be the most favorable scenario for stocks, it’s essential for investors to exercise caution. Defensive sectors such as utilities and consumer staples tend to outperform during this phase, providing stability to investment portfolios. Technology and materials sectors may struggle, reflecting the overall sense of caution in the market.

    Bull Flattener: Preparing for Turbulence

    Bull Flattener is a yield curve regime that arises when long-term interest rates decrease more than short-term rates. This regime often unfolds during the late stages of the business cycle when investors start pricing in the possibility of a recession and disinflation.

    Turbulence Ahead

    Bull Flattener is like a warning bell for investors. It suggests that turbulence may be on the horizon, and it’s time to prepare for potential economic challenges. Investors often become more risk-averse during this phase.

    Diversifying Portfolios

    In a Bull Flattener regime, equity investors begin to tilt their portfolios towards higher-quality investments as a hedge against rising volatility. Staples and utilities typically command leadership during these periods, while cyclicals, like technology and materials, may underperform as corporate earnings for economically sensitive sectors weaken.

    In summary, each of these yield curve regimes offers unique insights into the market environment. Bear Steepener and Bear Flattener are often seen as favorable for stocks, while Bull Steepener and Bull Flattener indicate times of caution and preparation. Understanding these regimes can help investors make informed decisions and adapt their portfolios to the prevailing economic conditions.

    Yield Curve Regimes and Economic Indicators

    A Deep Dive into Economic Indicators

    Now that you understand the four key yield curve regimes, let’s explore their relationship with important economic indicators. Economic indicators are statistical metrics that show the direction of economic activities. Popular economic indicators include GDP, unemployment rate, and inflation.

    The Yield Curve and GDP

    The yield curve, with its ability to reflect investor sentiment and economic expectations, is akin to an economic barometer. It captures the collective wisdom of market participants, and one of the key metrics it aligns with is Gross Domestic Product (GDP).

    Understanding GDP

    Gross Domestic Product (GDP) is a fundamental economic indicator, representing the monetary value of all goods and services produced within a country’s borders over a specific period. It serves as a comprehensive gauge of an economy’s health and vitality. A rising GDP typically signifies a flourishing economy, characterized by increased production, consumer spending, and business activity.

    The Steepening Effect

    When an economy is on an upward trajectory, experiencing robust growth, and generating a rising GDP, it sets in motion a chain reaction in the financial markets. One of the notable effects is the steepening of the yield curve.

    Bear Steepener and Bull Steepener Regimes

    During periods of economic expansion, two yield curve regimes tend to become more prevalent: Bear Steepener and Bull Steepener. These regimes share a common characteristic—the steepening of the yield curve. This is where the connection between GDP and the yield curve becomes particularly intriguing for investors.

    Bear Steepener: Riding the Wave of Growth

    In the context of GDP, a Bear Steepener regime is like riding the wave of economic growth. As GDP rises and the economy expands, long-term interest rates often increase at a faster rate than short-term rates. This phenomenon contributes to a steepening yield curve.

    Bull Steepener: Finding Safety in Growth

    On the other hand, a Bull Steepener regime occurs when economic conditions are uncertain or deteriorating. In such situations, investors seek safety in long-term government bonds, causing long-term interest rates to decrease more slowly than short-term rates. This, too, results in a steepening yield curve.

    Bullish Signs for Stocks

    Both Bear Steepener and Bull Steepener regimes can be seen as bullish signs for the stock market. In the former, the confidence in economic growth bolsters investor sentiment, while in the latter, the demand for safer assets keeps long-term rates relatively higher. In both scenarios, the stock market tends to respond positively, as investors view the economic outlook with optimism.

    Strategies for Investors

    For investors, understanding the interplay between the yield curve and GDP can be a valuable tool. It offers insights into the broader economic landscape and can help shape investment strategies. During periods of rising GDP and the associated steepening of the yield curve, investors may consider increasing their exposure to equities, particularly sectors that thrive in growth environments.

    However, it’s essential to remain vigilant and recognize that economic conditions can change. The yield curve can shift, and investors should adapt their strategies accordingly. While a steepening yield curve can be a bullish sign, it’s crucial to monitor other economic indicators and market trends to make informed investment decisions.

    Unemployment Rates and the Yield Curve

    Unemployment rates serve as a critical indicator of an economy’s well-being. They provide valuable insights into the balance between labor supply and demand, and their correlation with the yield curve offers a fascinating perspective on economic dynamics.

    Low Unemployment Rates: A Sign of Prosperity

    Low unemployment rates are typically seen as a harbinger of economic prosperity. When a significant portion of the workforce is employed, it signifies a strong economy where people have jobs, incomes, and purchasing power. This, in turn, fuels consumer spending, drives business expansion, and contributes to a positive economic outlook.

    The Perils of Overheating

    However, like any economic metric, extremes can bring their own set of challenges. When unemployment rates drop to exceptionally low levels, it can be a double-edged sword. On one hand, it reflects a robust job market and financial stability. On the other hand, it can signal an overheating economy.

    Inflationary Pressures

    An overheating economy, characterized by too low unemployment rates, can lead to rising inflationary pressures. As businesses compete for a limited pool of available workers, wages tend to rise. This increase in labor costs can get passed on to consumers in the form of higher prices for goods and services. Central banks, tasked with controlling inflation, may respond by raising interest rates to cool down the economy.

    The Flattening Yield Curve

    Here’s where the yield curve comes into play. When central banks increase short-term interest rates to combat inflationary pressures, it can lead to a flattening yield curve. This phenomenon often indicates a shift towards either the Bear Flattener or Bull Flattener regimes, depending on market dynamics.

    Bear Flattener: A Sign of Caution

    In the context of low unemployment rates and rising interest rates, a Bear Flattener regime may emerge. This signals a shift towards caution in the stock market. While economic growth may still be present, the tightening of monetary policy can create headwinds for equities.

    Bull Flattener: Navigating Economic Challenges

    Conversely, a Bull Flattener regime can also materialize. This regime suggests that the economy may be facing challenges, and investors are seeking safety in long-term bonds. It implies that despite low unemployment rates, there are concerns about economic stability and growth.

    Caution in Stock Market Investments

    Both Bear Flattener and Bull Flattener regimes serve as cautionary signals for stock market investments. In the former, it’s a reminder that economic conditions can change quickly, and the stock market may face headwinds. In the latter, it indicates that despite low unemployment rates, there are underlying concerns that warrant careful consideration.

    Strategies for Investors

    For investors, the relationship between unemployment rates and the yield curve underscores the importance of a balanced and adaptable approach. While low unemployment rates may signal economic strength, it’s essential to recognize the potential risks associated with overheating.

    Investors should keep a close eye on central bank actions and inflationary trends, as these can influence the shape of the yield curve. A flattening curve should prompt a review of investment portfolios, with a focus on diversification and risk management.

    How Inflation Affects the Yield Curve

    Inflation, the gradual increase in the general level of prices for goods and services, is a fundamental economic force that can wield considerable influence over the financial landscape. Its interplay with the yield curve is particularly intriguing, as it can have significant implications for both investors and policymakers.

    High Inflation: Stirring the Pot

    When inflation surges, it sets off a series of reactions throughout the economy. As prices rise, consumers’ purchasing power erodes, and businesses may pass on higher costs to customers. In response to mounting inflationary pressures, central banks often take action by raising short-term interest rates. This monetary policy move aims to cool down an overheating economy and keep inflation in check.

    The Steepening Effect

    Here’s where the yield curve comes into play. In an environment of high inflation and rising interest rates, the yield curve often tends to steepen. This means that long-term interest rates rise at a faster rate than short-term rates. This shift can push the yield curve towards steepening regimes, such as the Bear Steepener or Bull Steepener.

    Bear Steepener: Economic Growth Amid Inflation

    In the context of high inflation, a Bear Steepener regime may emerge. This regime signifies that despite inflationary pressures, investors have confidence in the economy’s growth prospects. The anticipation of continued economic expansion can bolster stock market performance, and investors may flock to equities in search of returns that outpace inflation.

    Bull Steepener: Seeking Safety Amid Inflation

    Conversely, a Bull Steepener regime can also materialize during high inflationary periods. This suggests that while inflation is a concern, there may be broader economic uncertainties at play. In such cases, investors may seek safety in long-term government bonds, which can keep long-term interest rates relatively higher.

    Low Inflation: Flattening Dynamics

    On the other end of the spectrum, when inflation remains subdued, it tends to exert a different influence on the yield curve. Low inflation can lead to a flattening yield curve, characterized by a narrower gap between short-term and long-term interest rates. This flattening effect can push the yield curve towards flattening regimes, such as the Bear Flattener or Bull Flattener.

    Bear Flattener: Caution Amid Low Inflation

    In a Bear Flattener regime during low inflation, investors may exercise caution. The narrowing yield curve implies that despite low inflation, there may be concerns about the broader economic landscape. It can be seen as a signal to approach stock market investments with care.

    Bull Flattener: Navigating Economic Challenges

    A Bull Flattener regime during low inflation suggests a cautious approach amid economic challenges. Despite subdued inflation rates, underlying economic uncertainties may prompt investors to seek safety in long-term bonds.

    Implications for Investors

    For investors, understanding the relationship between inflation and the yield curve is essential for navigating the complex terrain of financial markets. High inflation can present opportunities in a Bear Steepener regime, where economic growth prevails. Conversely, low inflation may signal a need for caution in both Bear Flattener and Bull Flattener regimes.

    Investors should remain vigilant, monitor inflation trends, and consider how central banks respond to inflationary pressures. Adjusting investment portfolios to align with the prevailing yield curve dynamics can help mitigate risks and capitalize on opportunities in an ever-changing economic landscape.

    Leveraging Yield Curve Insights for Investment Strategies

    Stock Market Sectors and Yield Curve Regimes

    The yield curve isn’t just a financial indicator; it can also serve as a compass for investors, pointing them towards the stock market sectors that are likely to thrive in different business cycles. By understanding the prevailing yield curve regime, investors can make more informed decisions about where to allocate their capital within the stock market.

    Bear Steepener: A Call for Cyclical Sectors

    During a Bear Steepener regime, where long-term interest rates rise faster than short-term rates, investors often find opportunities in cyclical sectors. These sectors are closely tied to economic growth and tend to perform well when the economy is on an upswing.

    Materials Sector

    One such sector is materials, which includes companies involved in the production of basic materials like metals, chemicals, and construction materials. When the yield curve steepens, it’s often a sign of economic optimism. Investors in the materials sector anticipate increased demand for raw materials as construction and manufacturing activities pick up.

    Industrials Sector

    Similarly, the industrials sector tends to shine during a Bear Steepener regime. This sector encompasses companies involved in manufacturing, aerospace, defense, and transportation. Economic expansion typically leads to higher demand for industrial goods and services, translating into strong performance for these companies.

    Bull Flattener: Seeking Defensive Sectors

    Conversely, during a Bull Flattener regime, when long-term interest rates fall faster than short-term rates, investors may opt for a more cautious approach. This often leads to a shift towards defensive sectors that are less sensitive to economic fluctuations.

    Utilities Sector

    The utilities sector, which includes companies involved in electricity, gas, and water supply, is a common choice during Bull Flattener regimes. Utilities are considered defensive because their demand tends to remain relatively stable regardless of economic conditions. Investors seek the stability of utility stocks during uncertain times.

    Consumer Staples Sector

    Another defensive sector to consider during a Bull Flattener regime is consumer staples. This sector encompasses companies that produce essential goods like food, beverages, and household products. These items are necessities, and demand for them tends to remain constant, making consumer staples stocks a reliable choice in times of economic uncertainty.

    Crafting a Sectoral Strategy

    Understanding the yield curve’s influence on stock market sectors empowers investors to craft a more strategic approach to their portfolios. By aligning sectoral investments with the prevailing yield curve regime, investors can potentially capitalize on market trends and mitigate risks.

    However, it’s crucial to remember that the yield curve is just one piece of the puzzle. Investors should consider a holistic approach to portfolio management, taking into account other economic indicators, company fundamentals, and their individual risk tolerance.

    Strategies for Different Yield Curve Regimes

    Investors who understand the dynamics of yield curve regimes can navigate the financial landscape with greater precision. Each regime presents unique opportunities and challenges, and crafting a well-informed investment strategy is key to success.

    Bear Steepener: Embrace Growth

    During a Bear Steepener regime, where long-term rates increase faster than short-term rates, investors may want to embrace growth-oriented sectors:

    Materials Sector

    Materials companies, involved in the production of basic materials like metals and chemicals, often flourish in this phase. Economic expansion boosts demand for raw materials, benefiting materials companies.

    Industrials Sector

    Industrials companies, including those in manufacturing and transportation, thrive when the economy is on an upswing. Increased economic activity drives demand for industrial goods and services.

    Financials Sector

    The financials sector, encompassing banks and financial institutions, can also be a wise choice during a Bear Steepener regime. These institutions often benefit from a steeper yield curve, which can enhance their profit margins.

    Bear Flattener: Seek Stability

    In a Bear Flattener regime, where short-term rates increase more than long-term rates, investors often turn to sectors that offer stability and resilience:

    Technology Sector

    Tech stocks tend to perform well in this regime. Technology companies are often less sensitive to interest rate changes and economic fluctuations, making them a favorable choice when yield curve flattening occurs.

    Real Estate Investments

    Real estate investments, such as real estate investment trusts (REITs), can also be attractive. These investments often provide steady income streams, making them appealing during periods of economic caution.

    Bull Steepener: Defensive Posture

    During a Bull Steepener regime, where short-term rates decrease more than long-term rates, investors may adopt a more defensive posture:

    Utilities Sector

    The utilities sector, known for its stable cash flows, can be a prudent choice during a Bull Steepener regime. Utilities tend to perform well when interest rates are falling.

    Consumer Staples Sector

    Consumer staples companies, producing essential goods, are another defensive option. These companies often enjoy consistent demand, irrespective of broader economic conditions.

    Bull Flattener: Exercise Caution

    In a Bull Flattener regime, where long-term rates decrease more than short-term rates, investors should exercise caution:

    High-Quality Stocks

    Consider focusing on high-quality stocks with strong fundamentals and reliable earnings. These stocks may provide stability in an environment of economic uncertainty.

    Diversification

    Diversify your portfolio by exploring non-equity assets, such as bonds or alternative investments. Diversification can help spread risk and provide a safety net during market turbulence.

    Adapting to Change

    It’s important to note that yield curve regimes are not static, and economic conditions can evolve. Investors should regularly monitor the yield curve, economic indicators, and market trends to adapt their strategies accordingly. A well-diversified portfolio that aligns with the prevailing yield curve dynamics can help investors navigate the complexities of the financial markets.

    The Pitfalls of Relying Solely on the Yield Curve

    The yield curve is undeniably a valuable tool for investors and economists alike. Its ability to provide insights into economic conditions and potential market trends is unmatched. However, it’s crucial to remember that while the yield curve can be a guiding star, it should not be the sole beacon of light in the vast sea of financial markets.

    The Complex Web of Market Variables

    Financial markets are a complex web of interrelated variables and factors. Market conditions are influenced by a multitude of economic indicators, geopolitical events, corporate earnings, and investor sentiment, among other things. Relying solely on the yield curve to make investment decisions can be akin to navigating a ship with a single star as your guide. It might provide a sense of direction, but it doesn’t account for the many other celestial bodies in the sky.

    The Need for a Balanced Approach

    A balanced approach to investing is essential for success. While the yield curve can offer valuable insights into the future direction of interest rates and the broader economy, it should be considered alongside a broader set of market indicators and trends. Here are a few reasons why:

    Economic Variables

    • Unemployment Rates: As mentioned earlier, low unemployment rates can be a sign of economic strength but can also signal overheating. A comprehensive view of economic indicators is needed to gauge the overall health of the job market.
    • Inflation: Inflation trends play a significant role in shaping market conditions. Monitoring inflation rates, along with the yield curve, provides a more complete picture of economic dynamics.

    Geopolitical Events

    Global Events: Geopolitical events, such as trade tensions, political instability, or international conflicts, can have profound effects on financial markets. These events are not captured by the yield curve alone.

    Market Sentiment

    Investor Sentiment: Market sentiment can swing dramatically based on news, rumors, or social media trends. Understanding the psychology of investors and sentiment indicators is crucial for anticipating market moves.

    The Art of Diversification

    Diversification is another critical component of a balanced investment strategy. Spreading investments across various asset classes, such as stocks, bonds, real estate, and alternative investments, can help mitigate risks associated with any single market indicator or trend.

    Asset Allocation

    • Stocks: Equities provide opportunities for capital appreciation but come with volatility. The choice of sectors within the stock market should align with the prevailing economic conditions, as indicated by the yield curve and other factors.
    • Bonds: Fixed-income securities, including bonds, can provide stability and income. The yield curve can guide bond selection, but credit quality and interest rate risk should also be considered.

    Risk Management

    Alternative Investments, Assets like real estate, commodities, and alternative investments can further diversify a portfolio. These assets may respond differently to market conditions, offering risk mitigation benefits.

    The Path to Informed Decisions

    In conclusion, while the yield curve is a powerful tool for understanding economic dynamics and making informed investment decisions, it should not be used in isolation. Investors should adopt a holistic approach that considers a wide range of variables, market indicators, and asset classes.

    By doing so, investors can navigate the complex world of financial markets with greater confidence, adapt to changing conditions, and make well-rounded investment choices that align with their financial goals and risk tolerance.

    Conclusion

    Key TakeawayWhat It Means for You
    Recognize Yield Curve RegimesEnhance your understanding of the market and optimize your investment strategies.
    Link Regimes to Economic IndicatorsUse regimes to gain insight into larger economic trends.
    Diversify Investment StrategiesDon’t rely solely on the yield curve; incorporate other tools and analyses for a balanced portfolio.

    Understanding and leveraging the key yield curve regimes can significantly enhance your investment strategies and potentially lead to greater financial success. By identifying the current regime, linking it to broader economic indicators, and adapting your investment strategies accordingly, you can navigate the complexities of the stock and bond markets more effectively.

    Click here to read our latest article on Optimizing Your Trading Journal

    FAQs

    What is a Yield Curve Regime? A Yield Curve Regime refers to the prevailing shape and movement of the yield curve, indicating the relationship between short-term and long-term interest rates.

    How many types of Yield Curve Regimes are there? There are four primary Yield Curve Regimes: Bear Steepener, Bear Flattener, Bull Steepener, and Bull Flattener.

    What does a Bear Steepener regime signify for investors? A Bear Steepener regime indicates an economic upswing and is favorable for sectors like materials, industrials, and financials.

    Which sectors tend to perform well during a Bear Flattener regime? Tech stocks and real estate investments often perform well during a Bear Flattener regime.

    In a Bull Steepener regime, which sectors are considered suitable for investment? Defensive sectors like utilities and consumer staples are often chosen during a Bull Steepener regime.

    What is the significance of a Bull Flattener regime for investors? A Bull Flattener regime suggests caution, and investors may focus on high-quality stocks and diversify into non-equity assets.

    How does the yield curve relate to Gross Domestic Product (GDP)? A rising GDP often leads to yield curve steepening, which can be seen as a bullish sign for the stock market.

    What happens to the yield curve in the presence of low unemployment rates? Low unemployment rates can lead to yield curve flattening, signaling potential economic headwinds and caution in stock market investments.

    How does inflation affect the yield curve? High inflation often results in a steepening yield curve, while low inflation tends to flatten the curve.

    Why should investors not rely solely on the yield curve for investment decisions? The yield curve is a valuable tool but should be used alongside other market indicators and trends to account for the complexity of financial markets.

    Click here to learn more about Yield Curves